0 x 0
XSSMMDLGXL2XL

Command Palette

Search for a command to run...

Skip to content
ParsertimeParsertime
FeaturesPricingStatsAbout
Get Started
Latest updatesv3.0 - Our biggest yet→

Scrim analytics · Overwatch 2

Every stat the scoreboard doesn't show you

Parsertime turns raw scrim data into skill ratings, trend lines, and the insights that change how you coach.

Get StartedSee a live demo →

Trusted by 436+ teams

parsertime.app
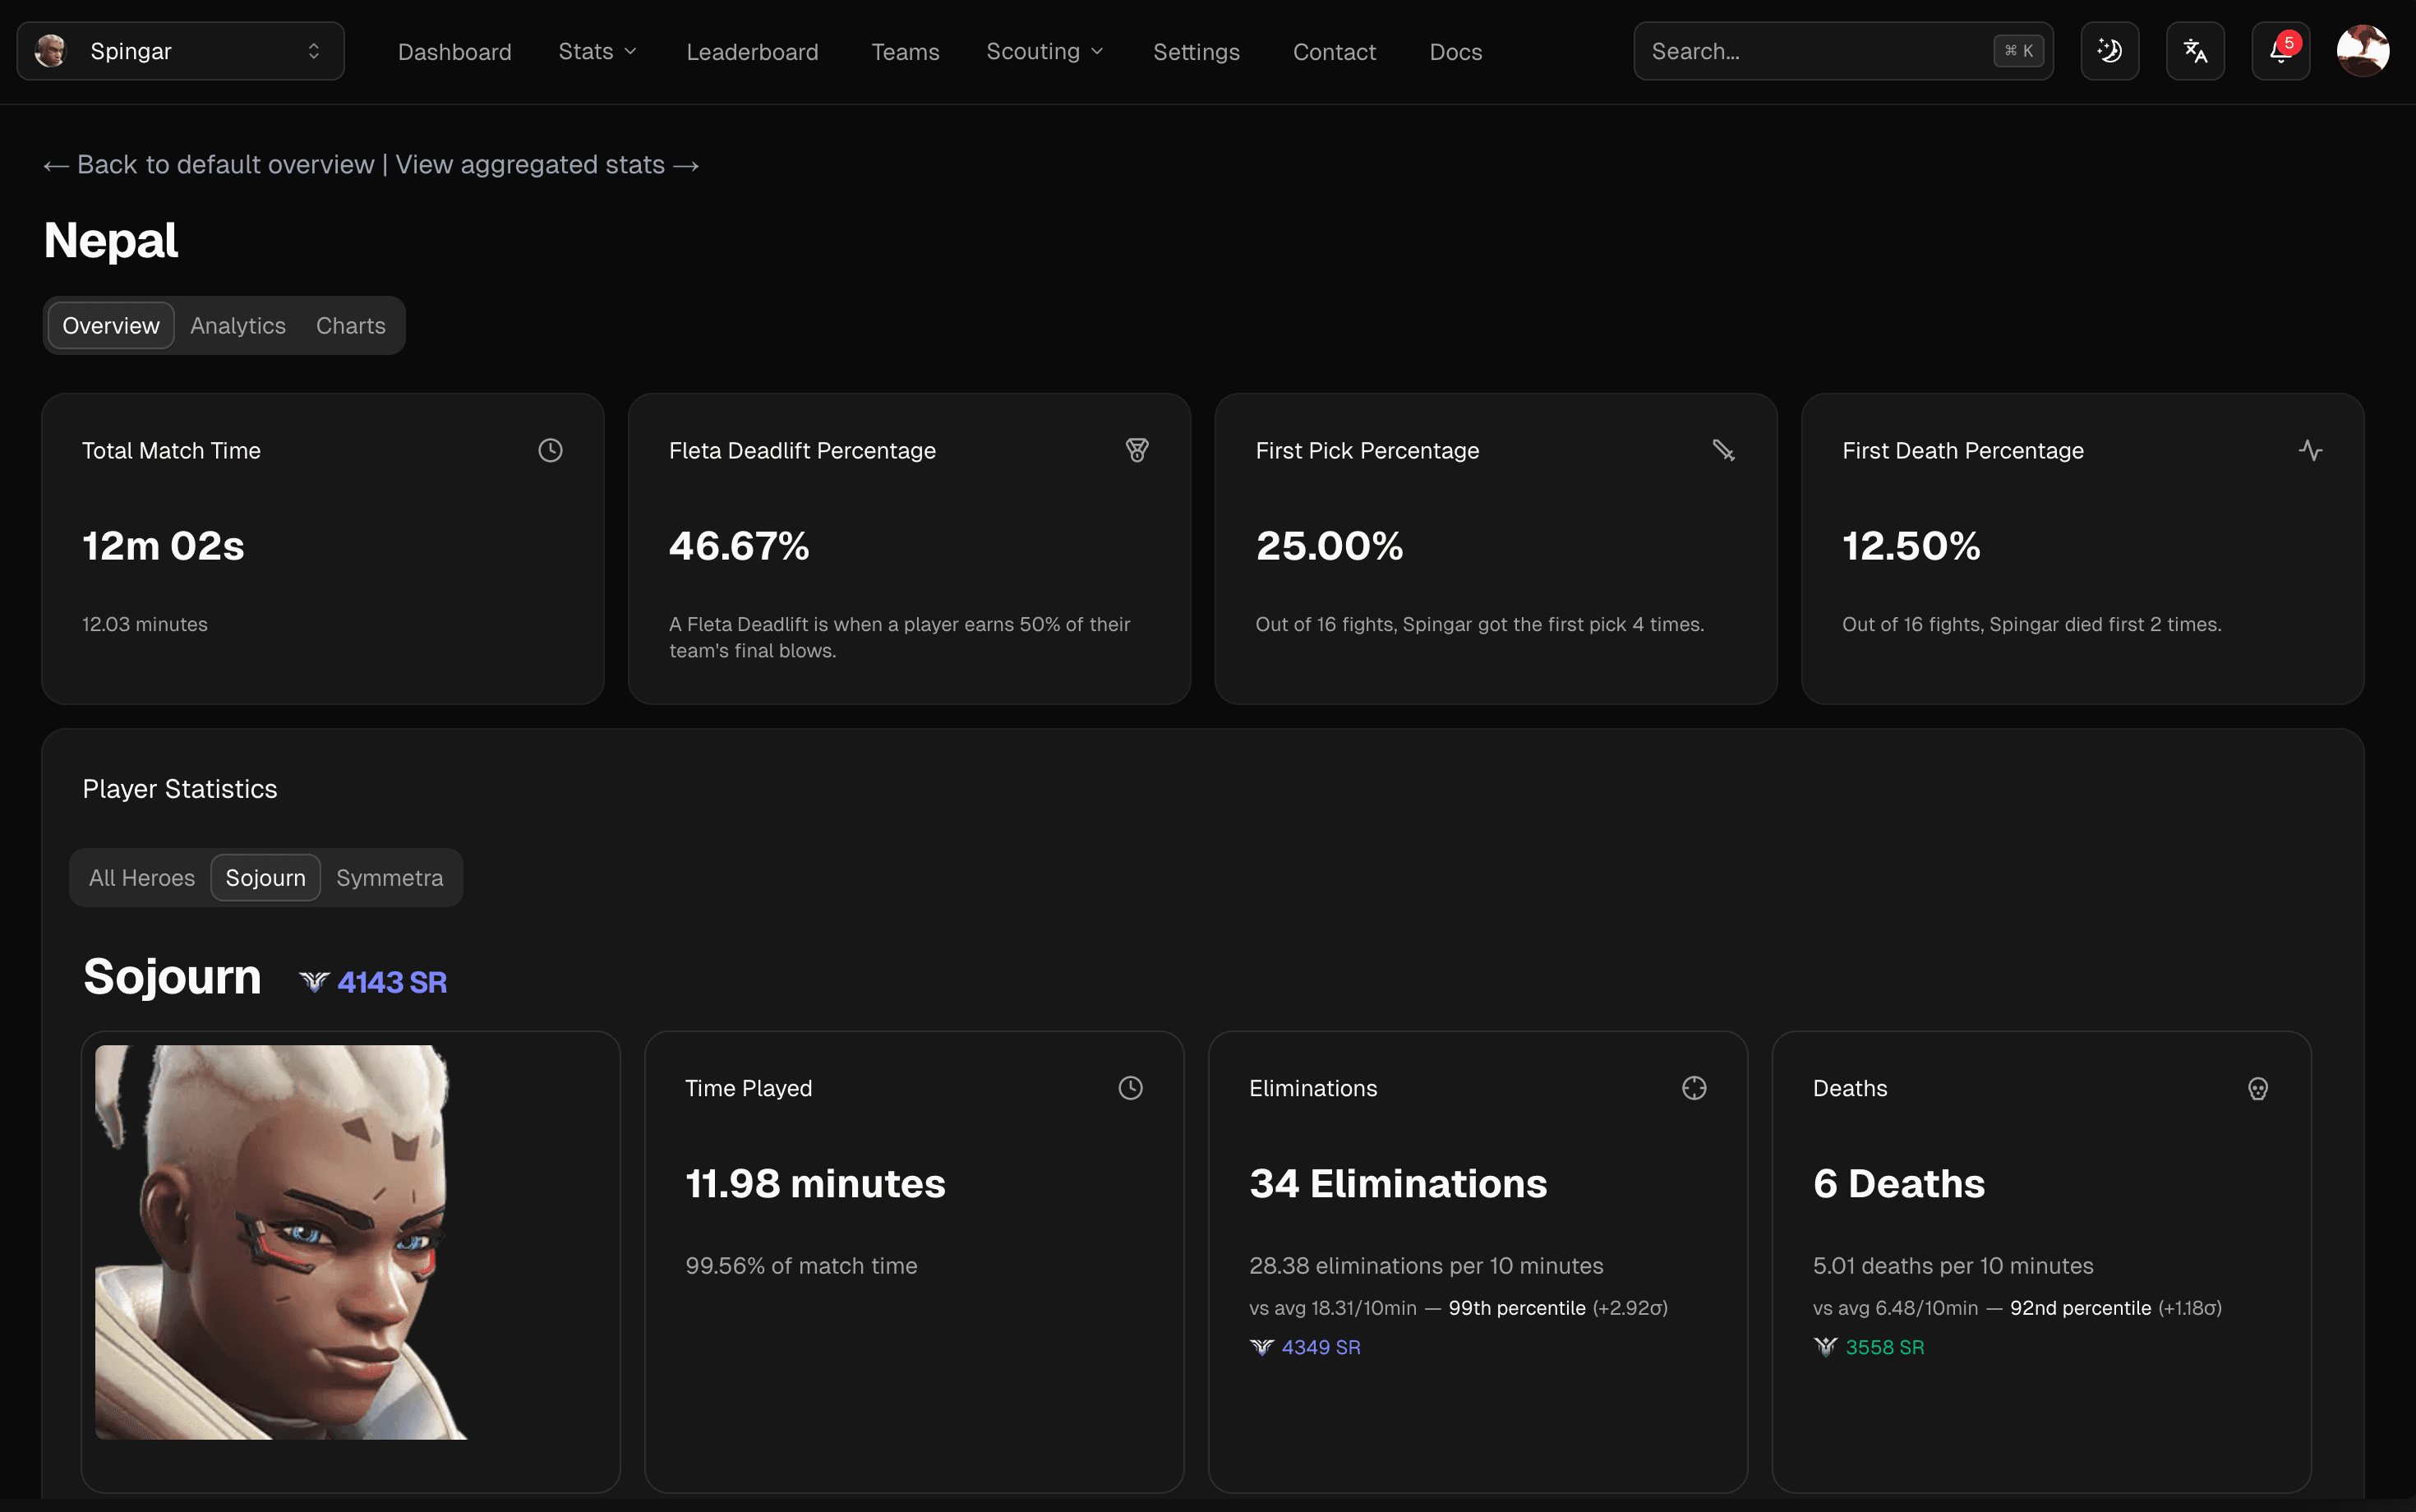
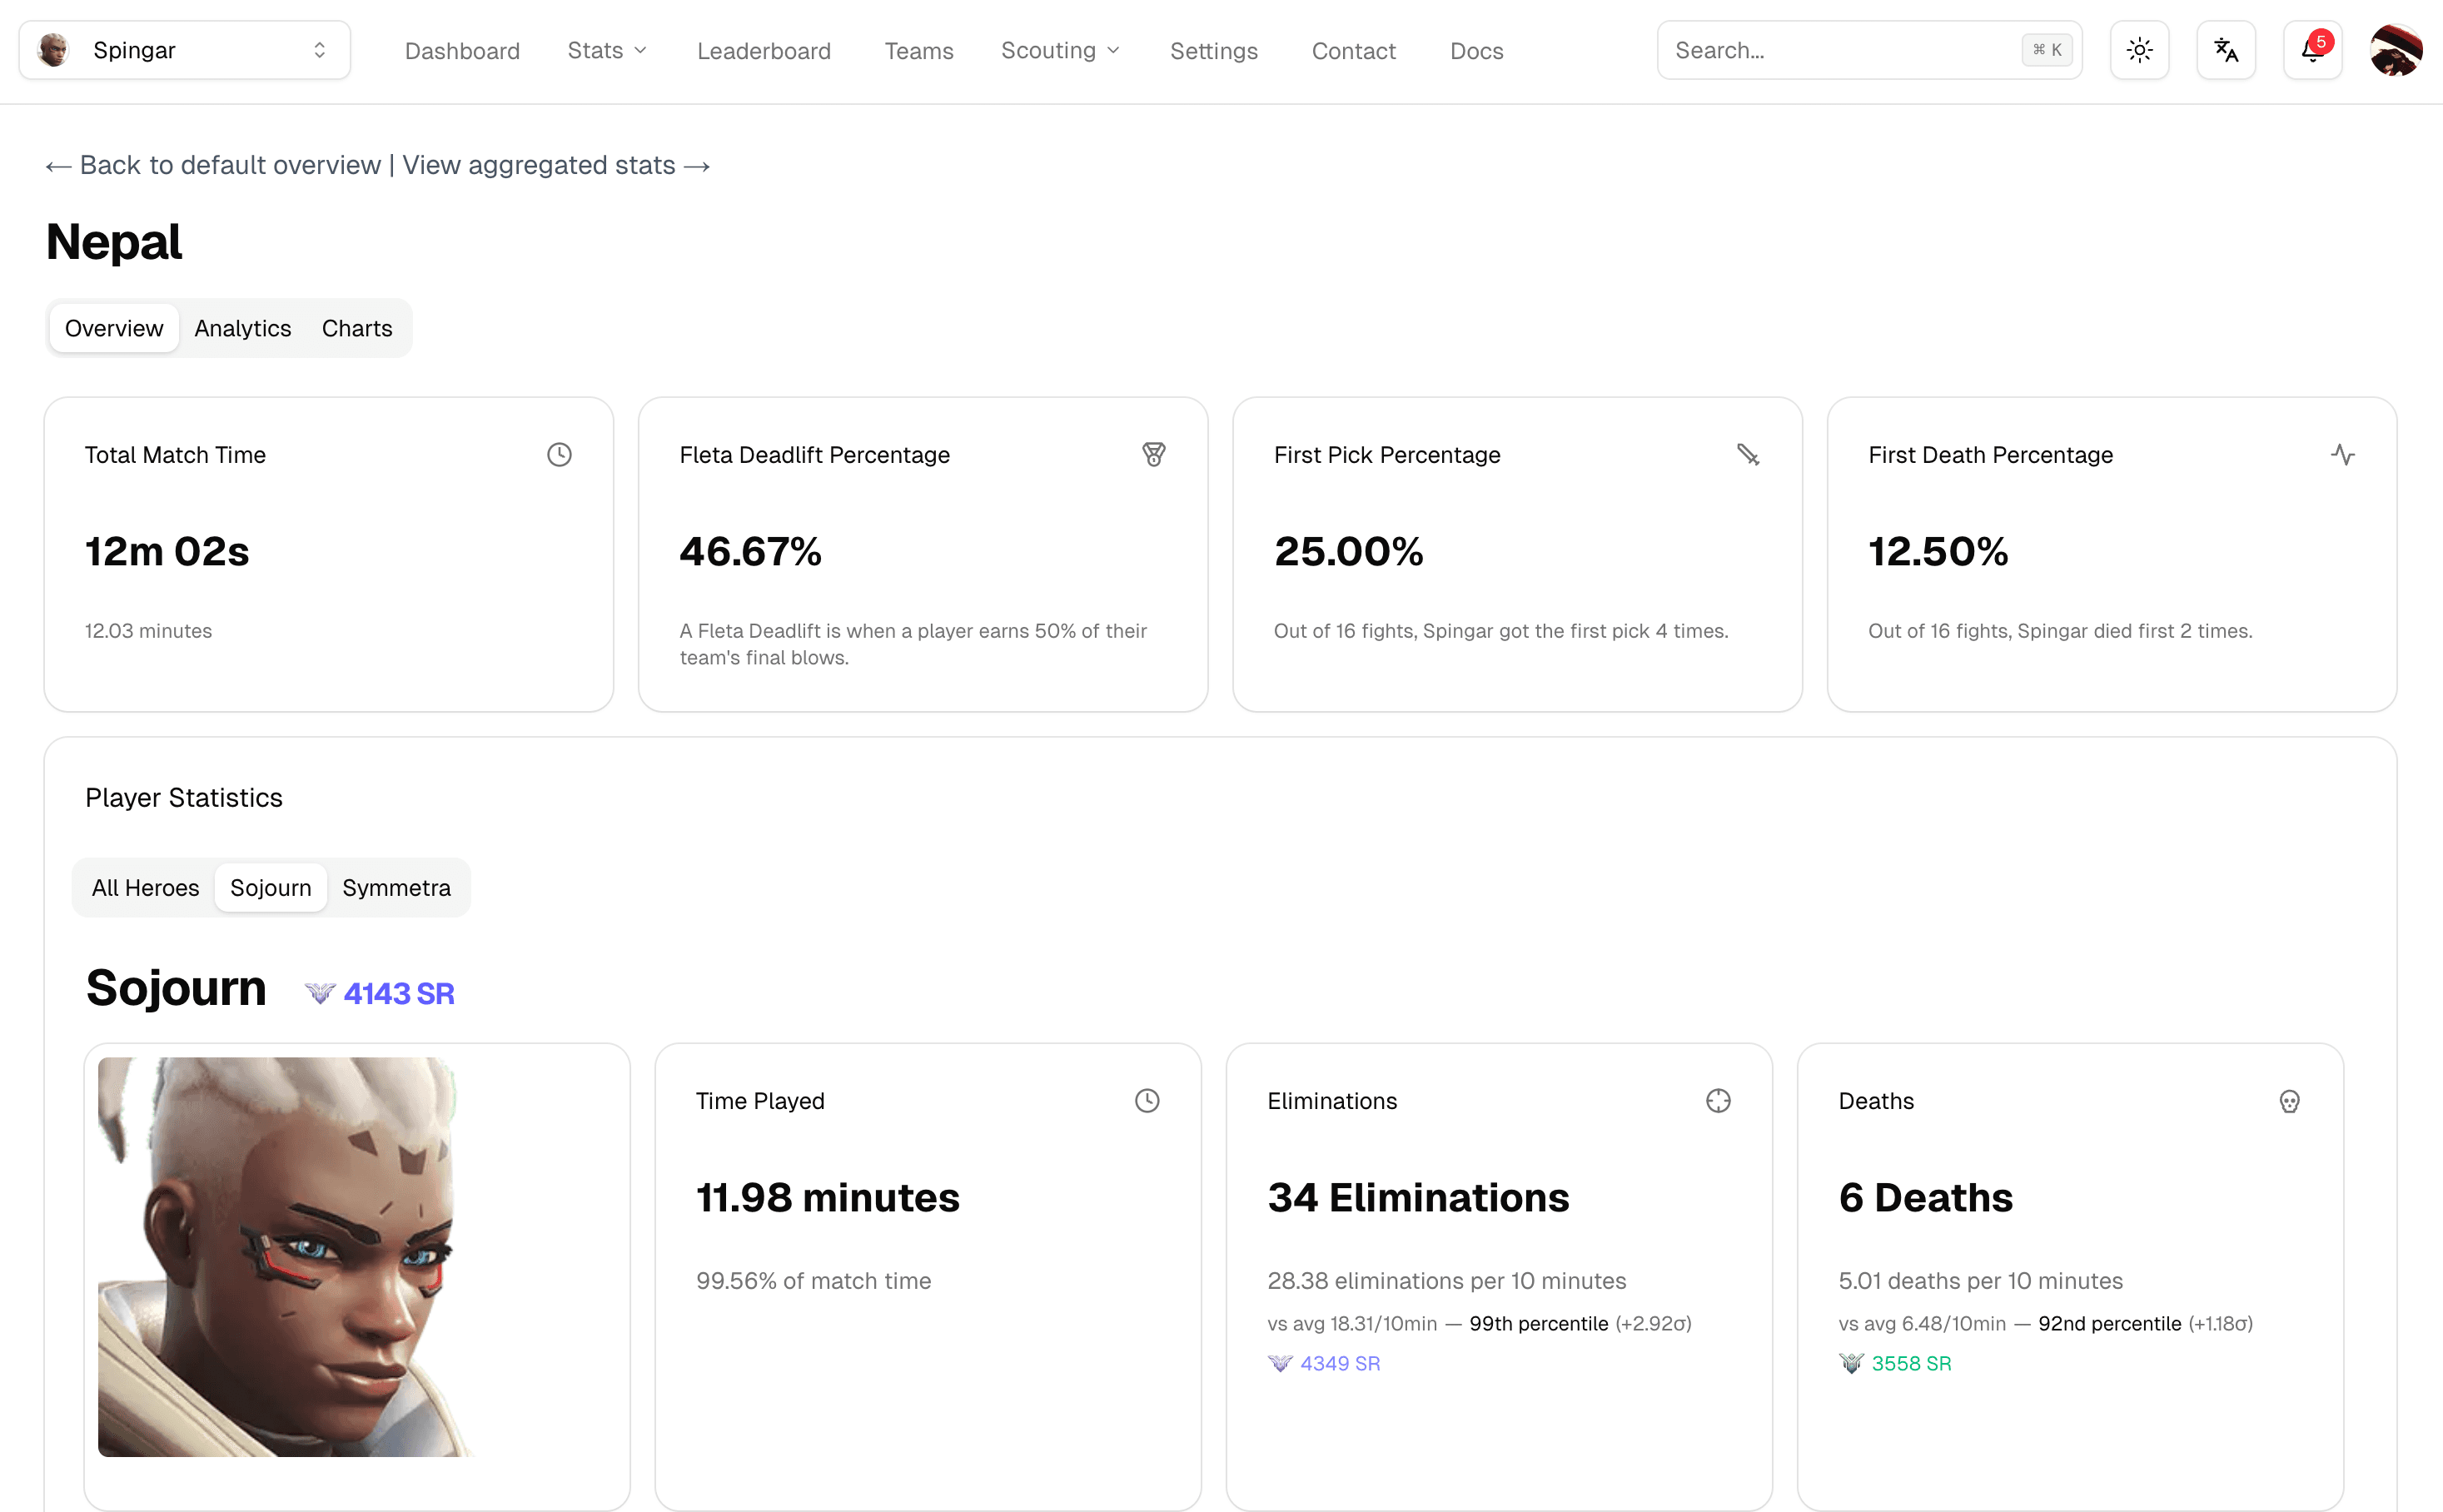
Parsertime player analytics dashboard showing skill ratings and performance chartsParsertime player analytics dashboard showing skill ratings and performance charts

Eliminations · Sojourn

28.38

per 10 min

99th percentile (+2.92σ)

Hero SR · Sojourn

4143

▲ 4349 on elims

First pick in 25% of fights

Live platform data
Stats tracked
0+
Kills tracked
0+
Maps uploaded
0+
Uptime guarantee
99.99%

Trusted by collegiate and professional teams

Disguised
St. Clair College
Cornell University
Florida International University
Georgia State University
VLLN
Briar Cliff University
Bowling Green State University
ETS Esports
Disguised
St. Clair College
Cornell University
Florida International University
Georgia State University
VLLN
Briar Cliff University
Bowling Green State University
ETS Esports
Disguised
St. Clair College
Cornell University
Florida International University
Georgia State University
VLLN
Briar Cliff University
Bowling Green State University
ETS Esports
Disguised
St. Clair College
Cornell University
Florida International University
Georgia State University
VLLN
Briar Cliff University
Bowling Green State University
ETS Esports

New in v3

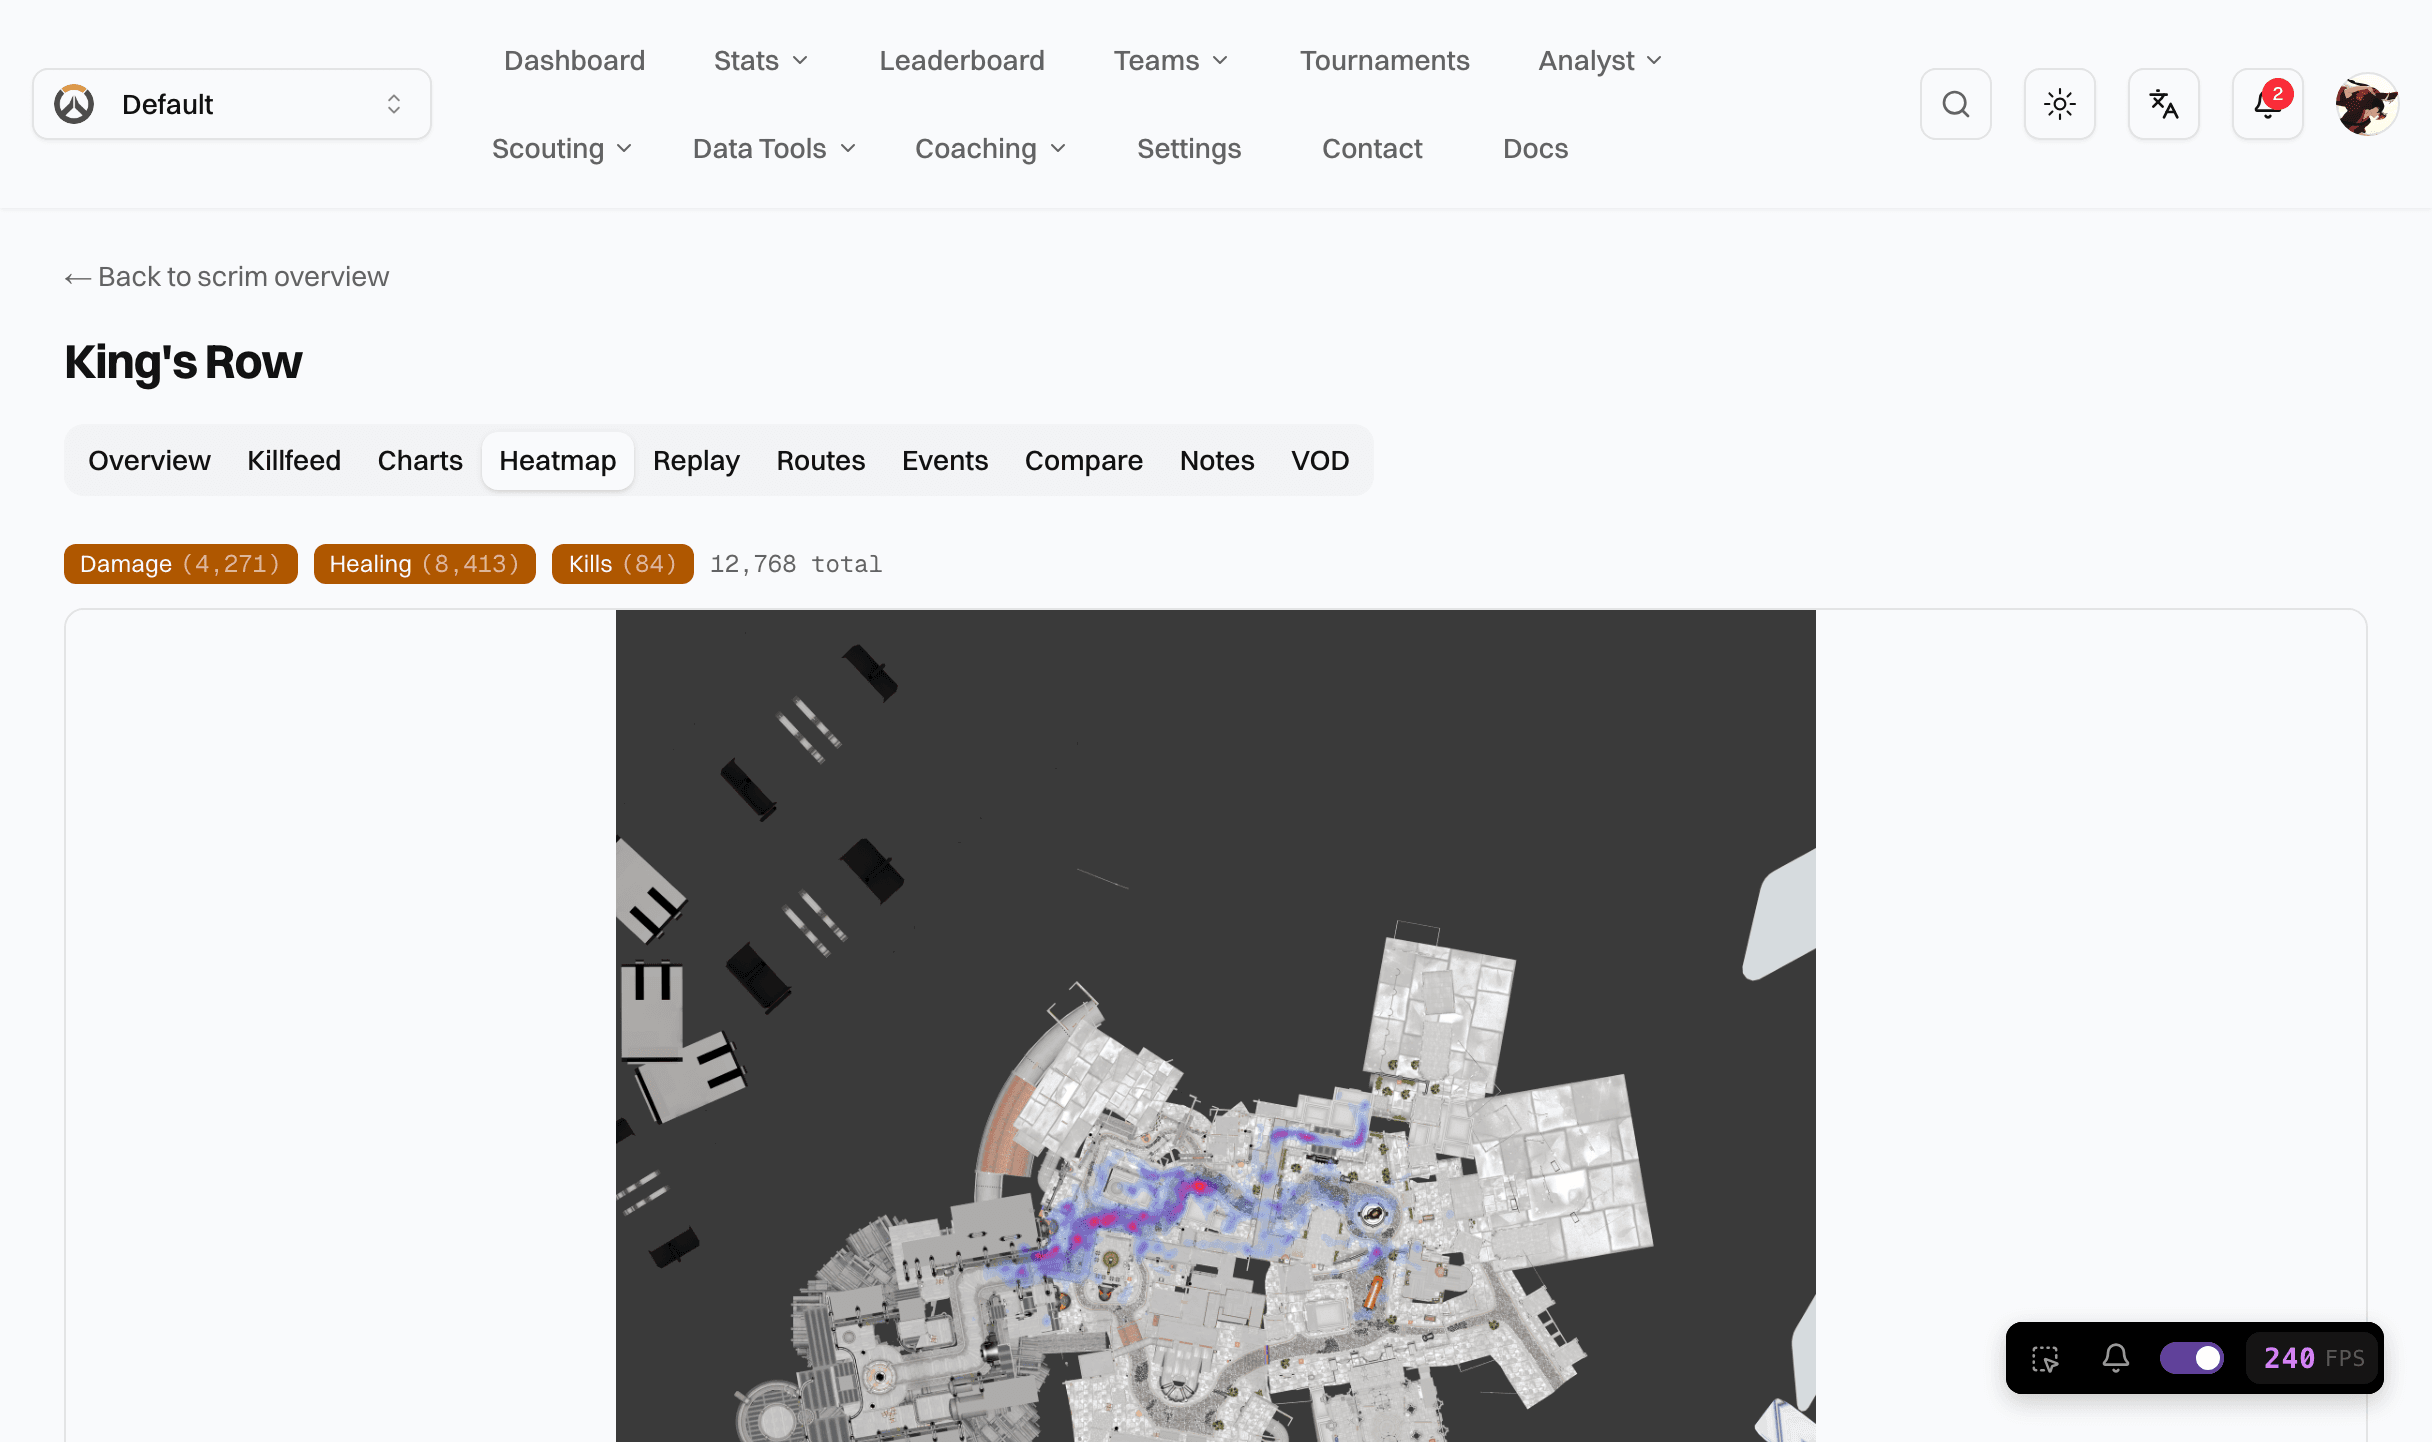
See the fight from above

First-of-its-kind positional analytics for Overwatch 2. Every scrim becomes a top-down replay: watch rotations unfold, find the angles you keep dying to, and measure positioning with numbers no other tool has.
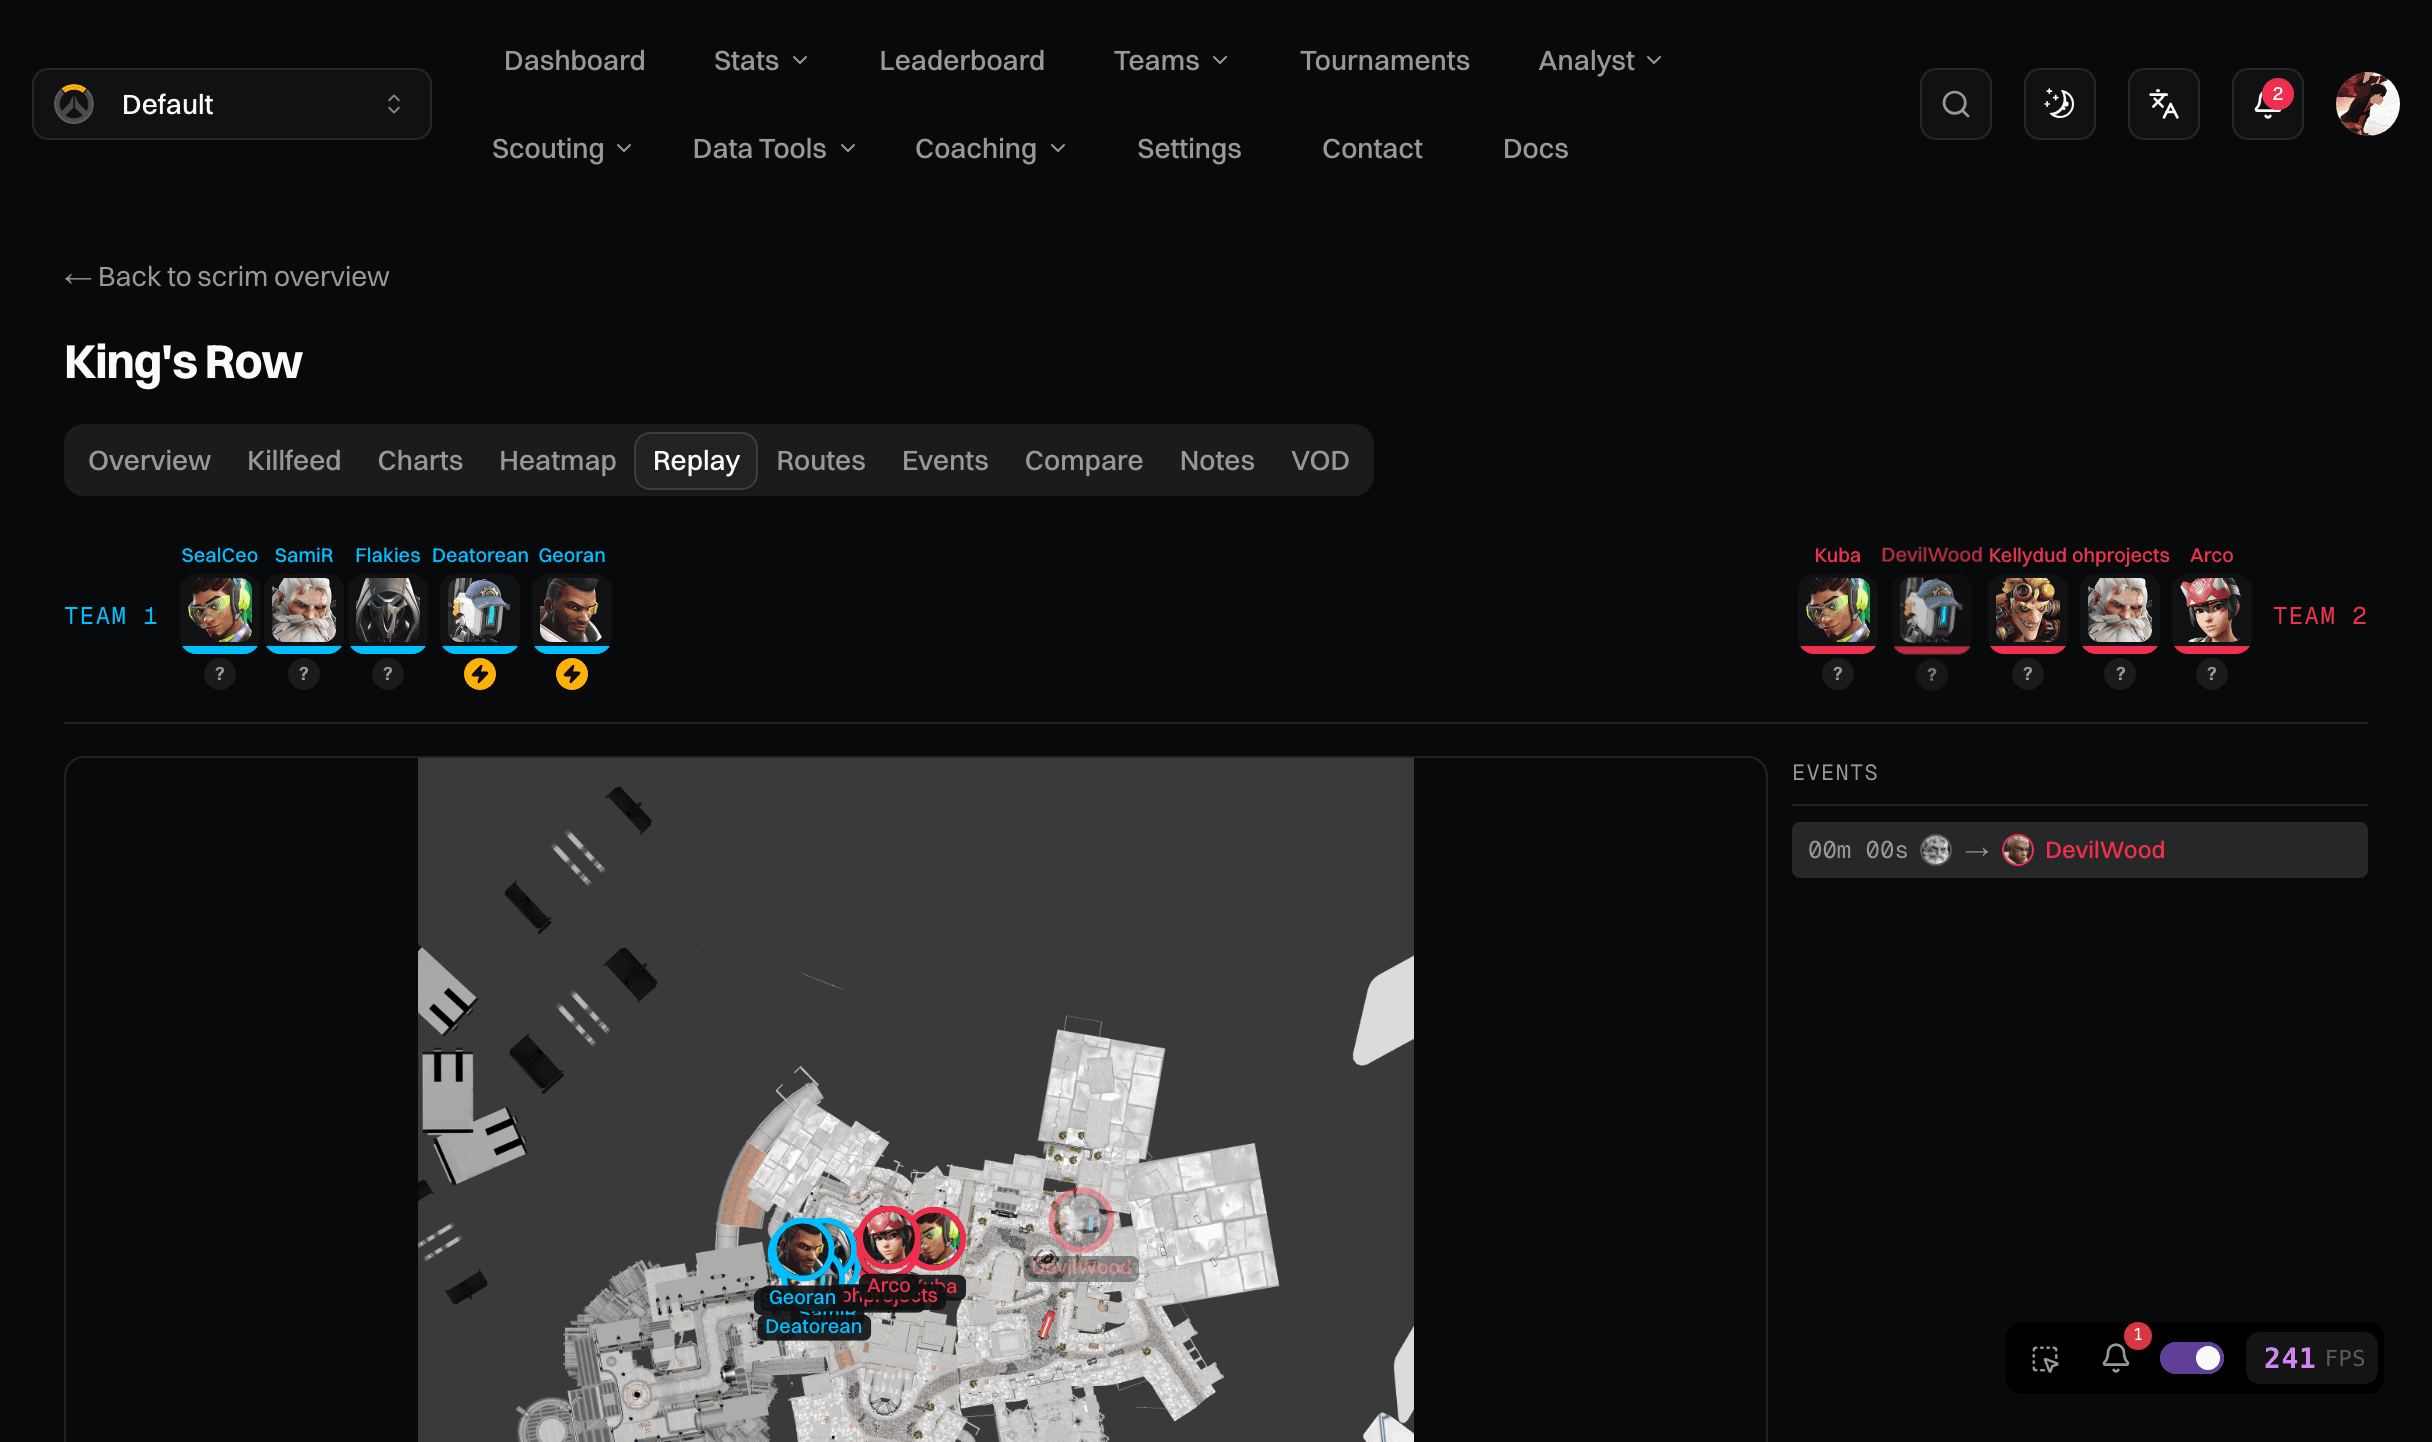
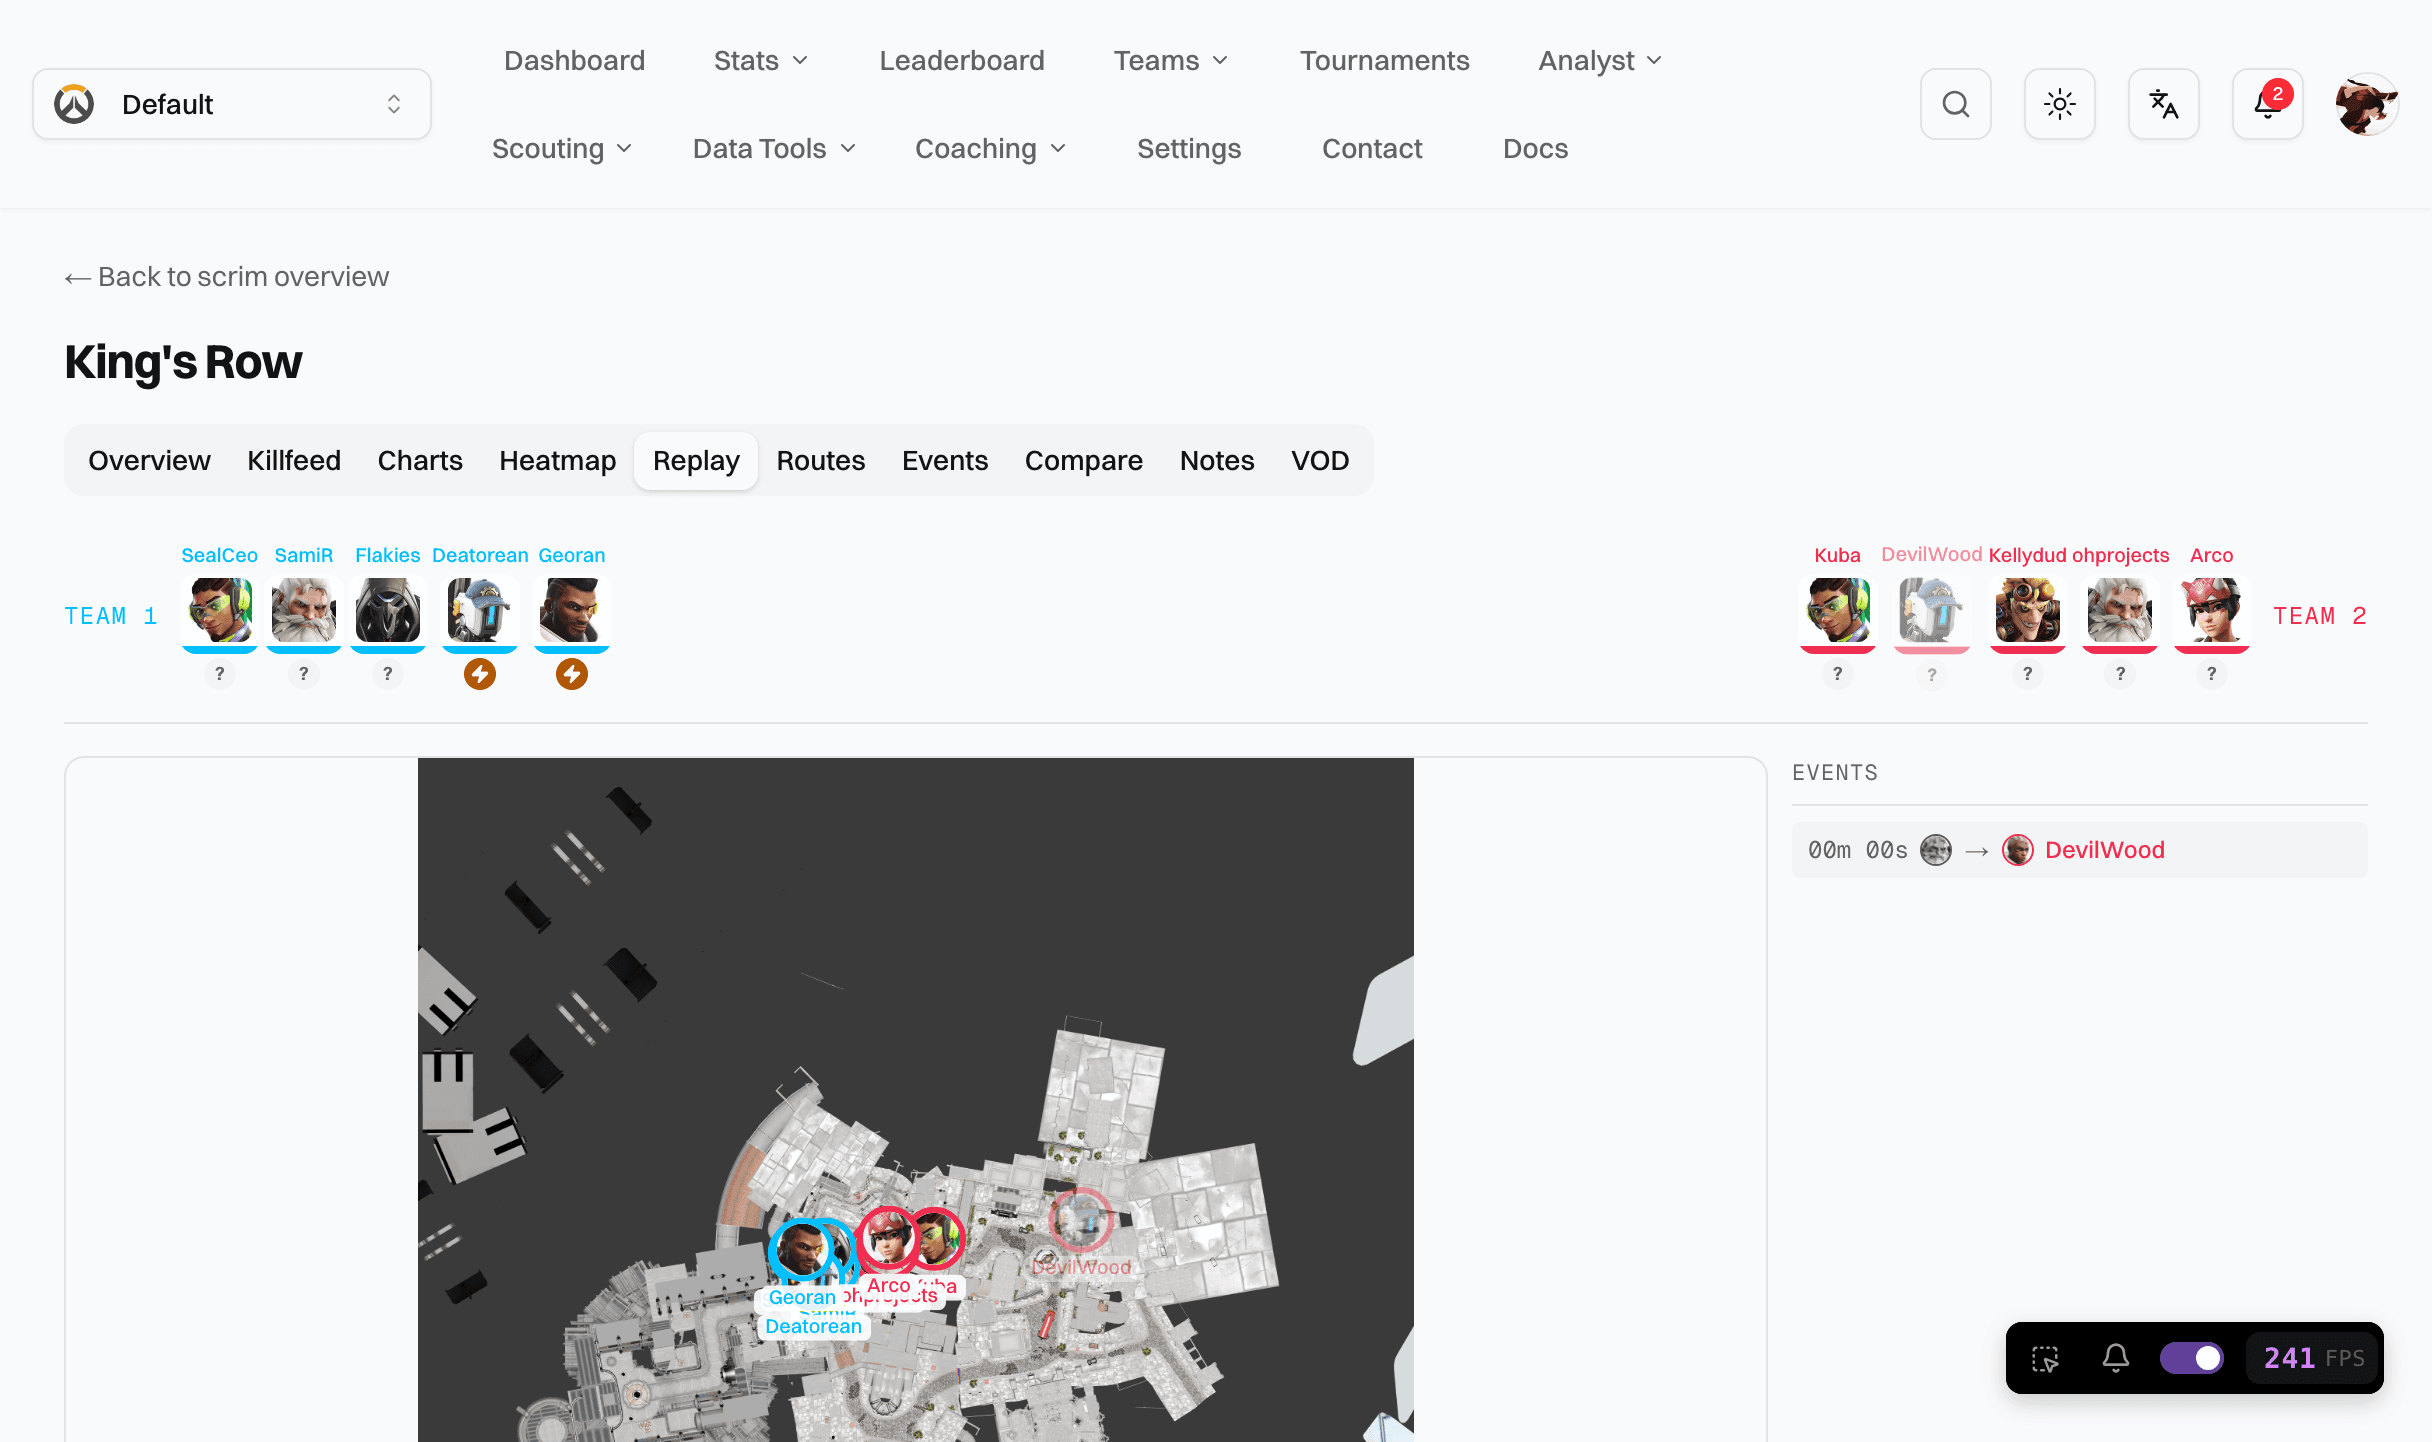
parsertime.app · map replay
Top-down map replay of a King's Row teamfight with player positions for both teamsTop-down map replay of a King's Row teamfight with player positions for both teams
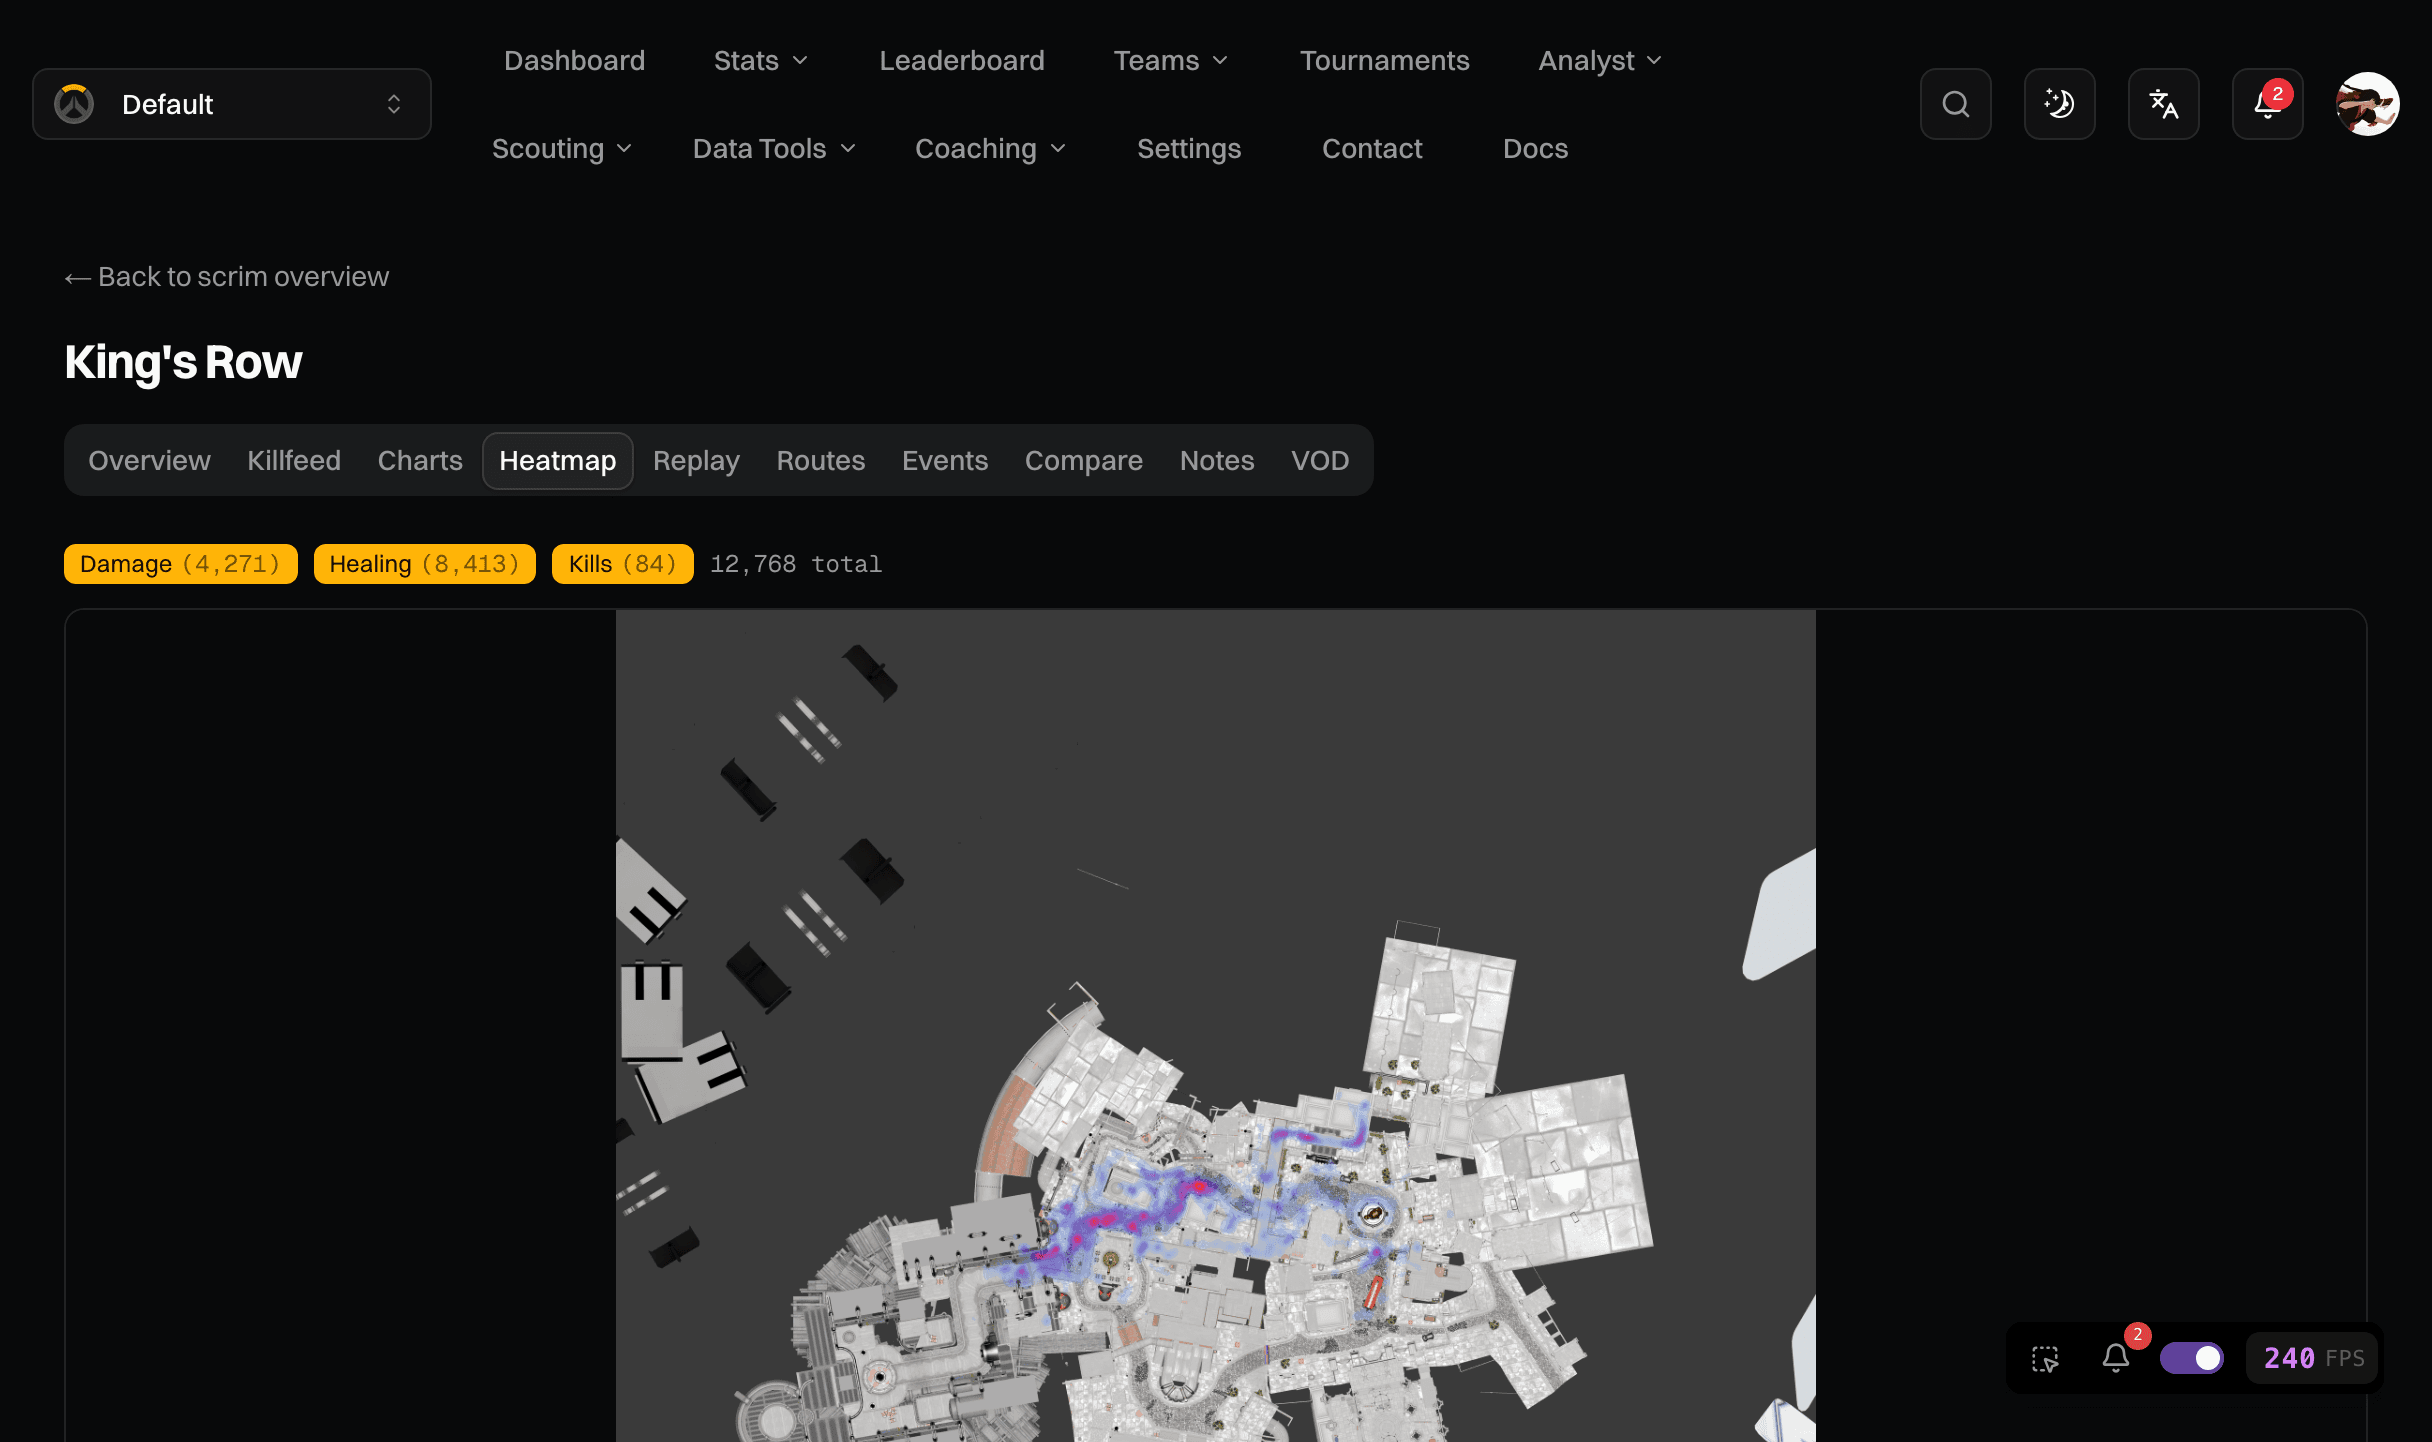
heatmap
Damage and kill density heatmap rendered over King's Row

Built for competition

See what the scoreboard doesn't show

Parsertime captures the full picture — killfeeds, hero swaps, ultimate economy, and role-specific performance — so you can coach with data, not guesswork.
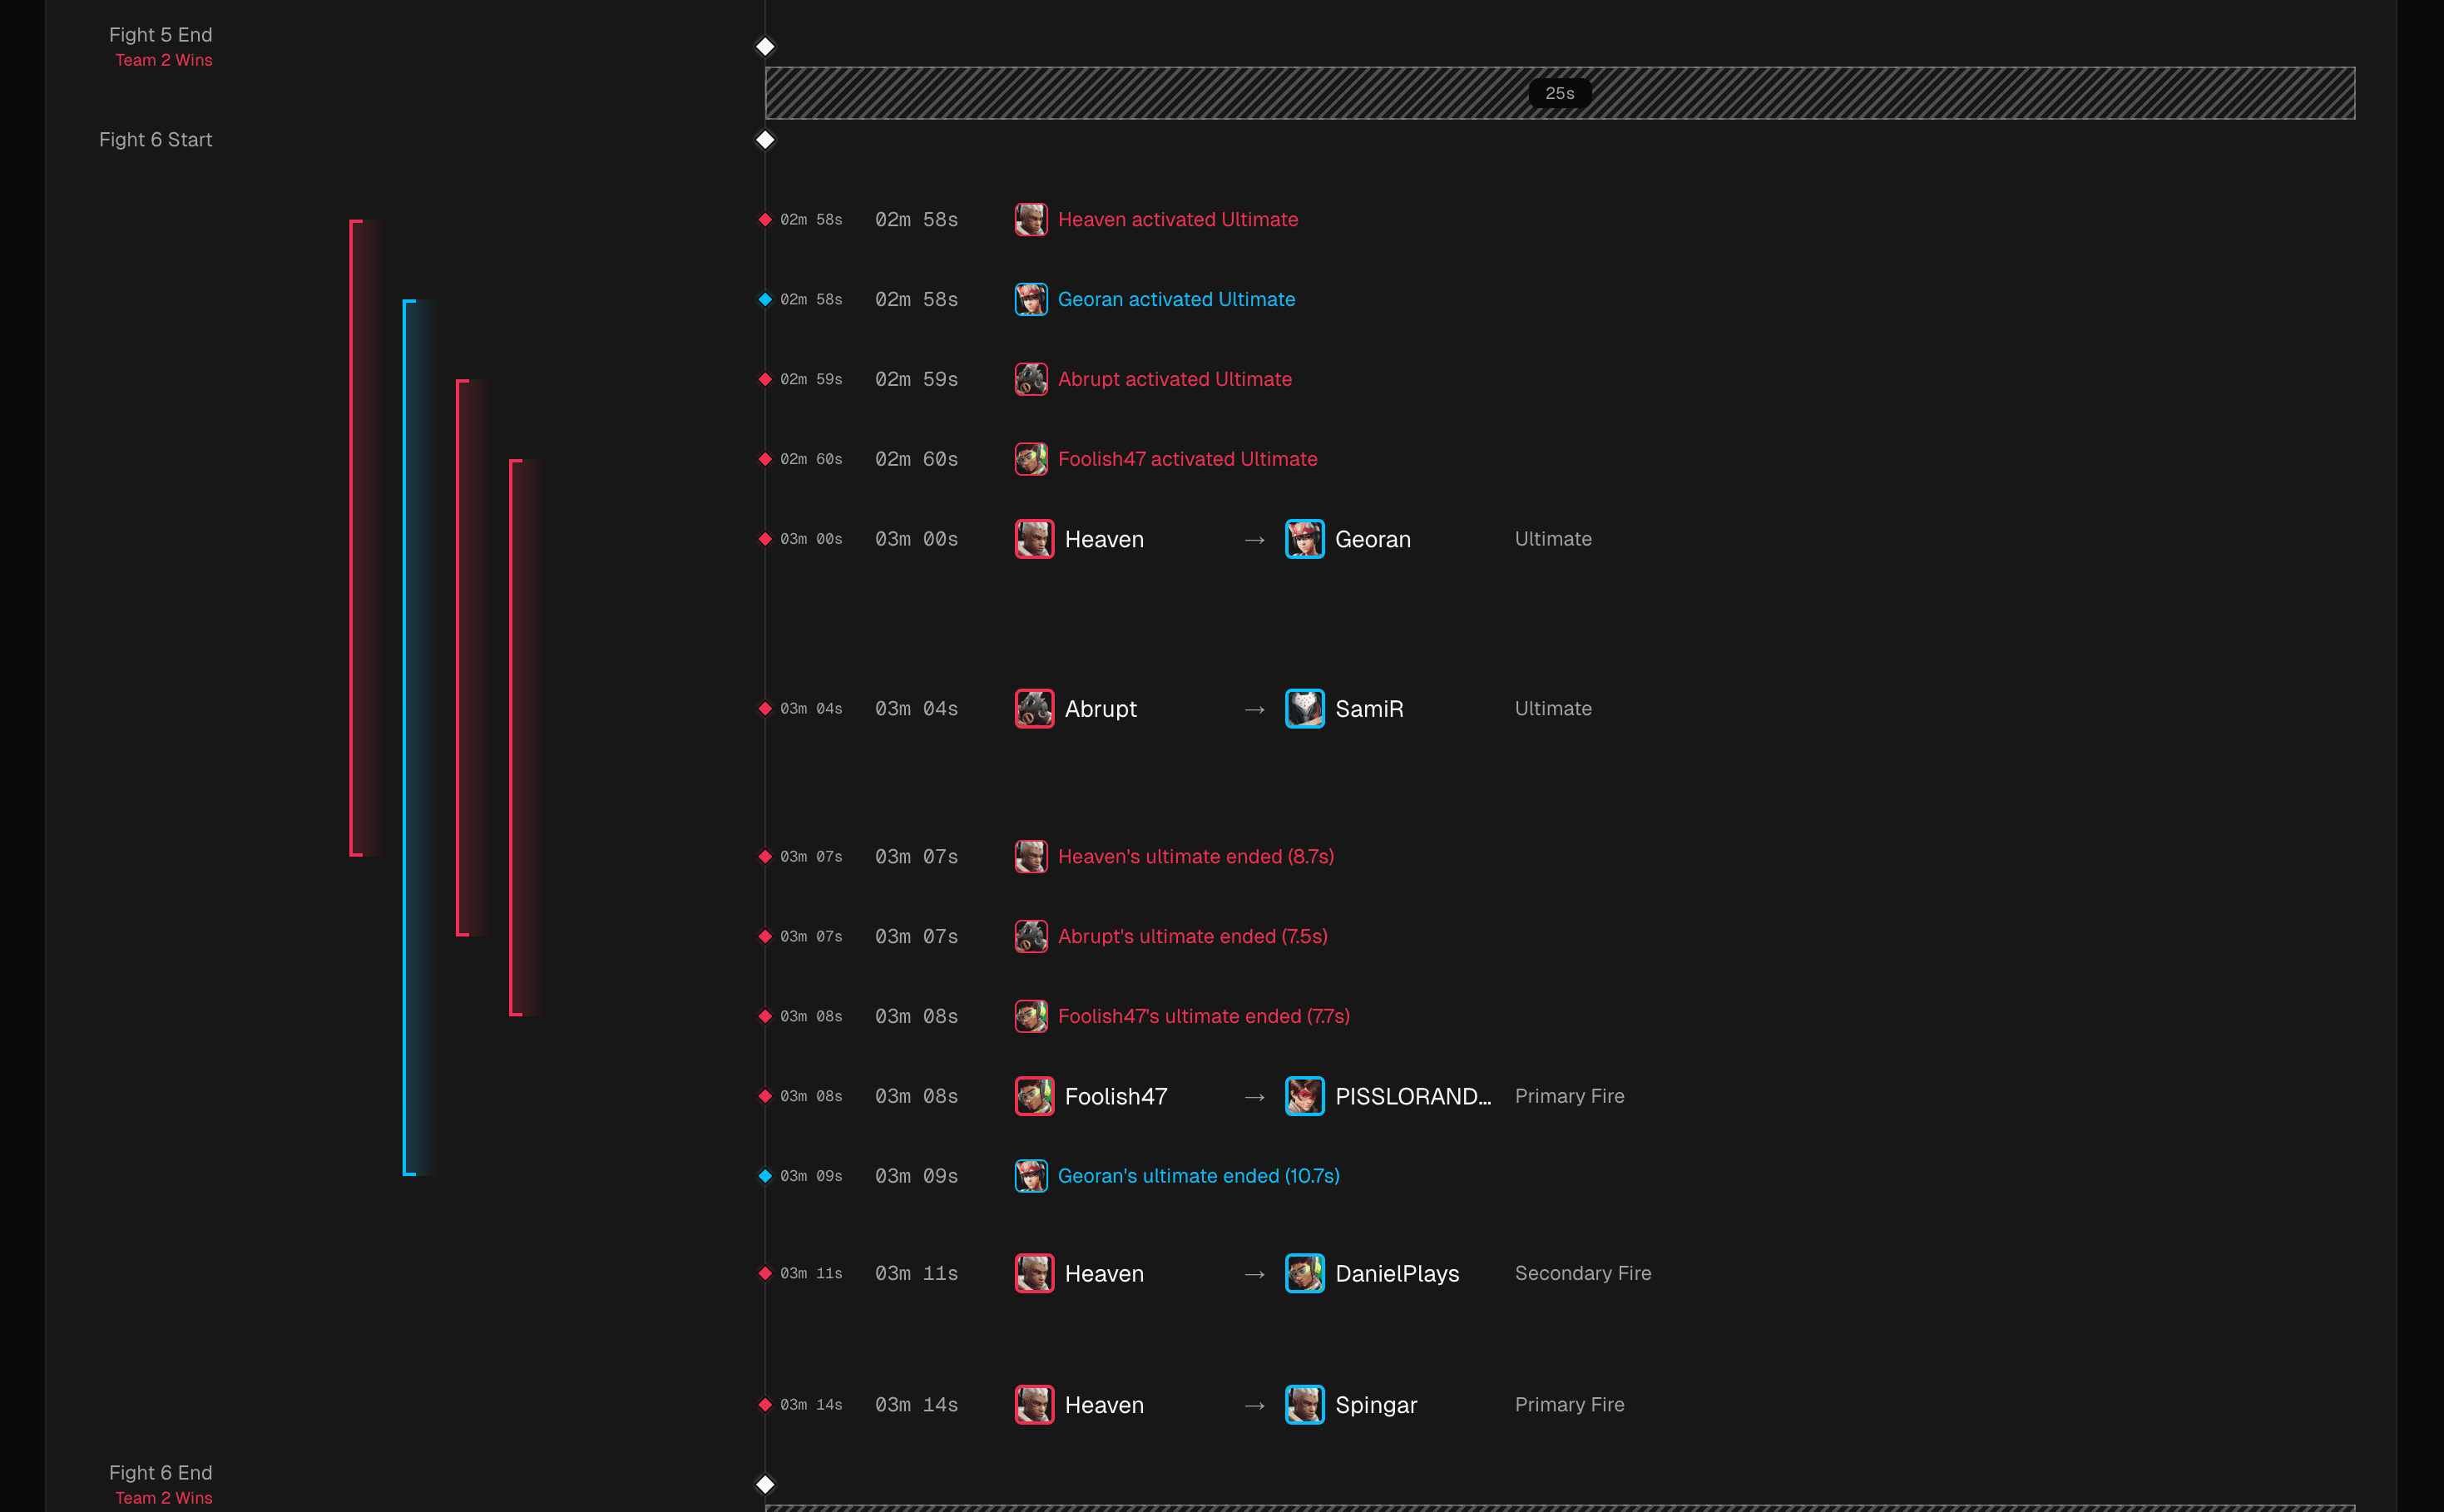
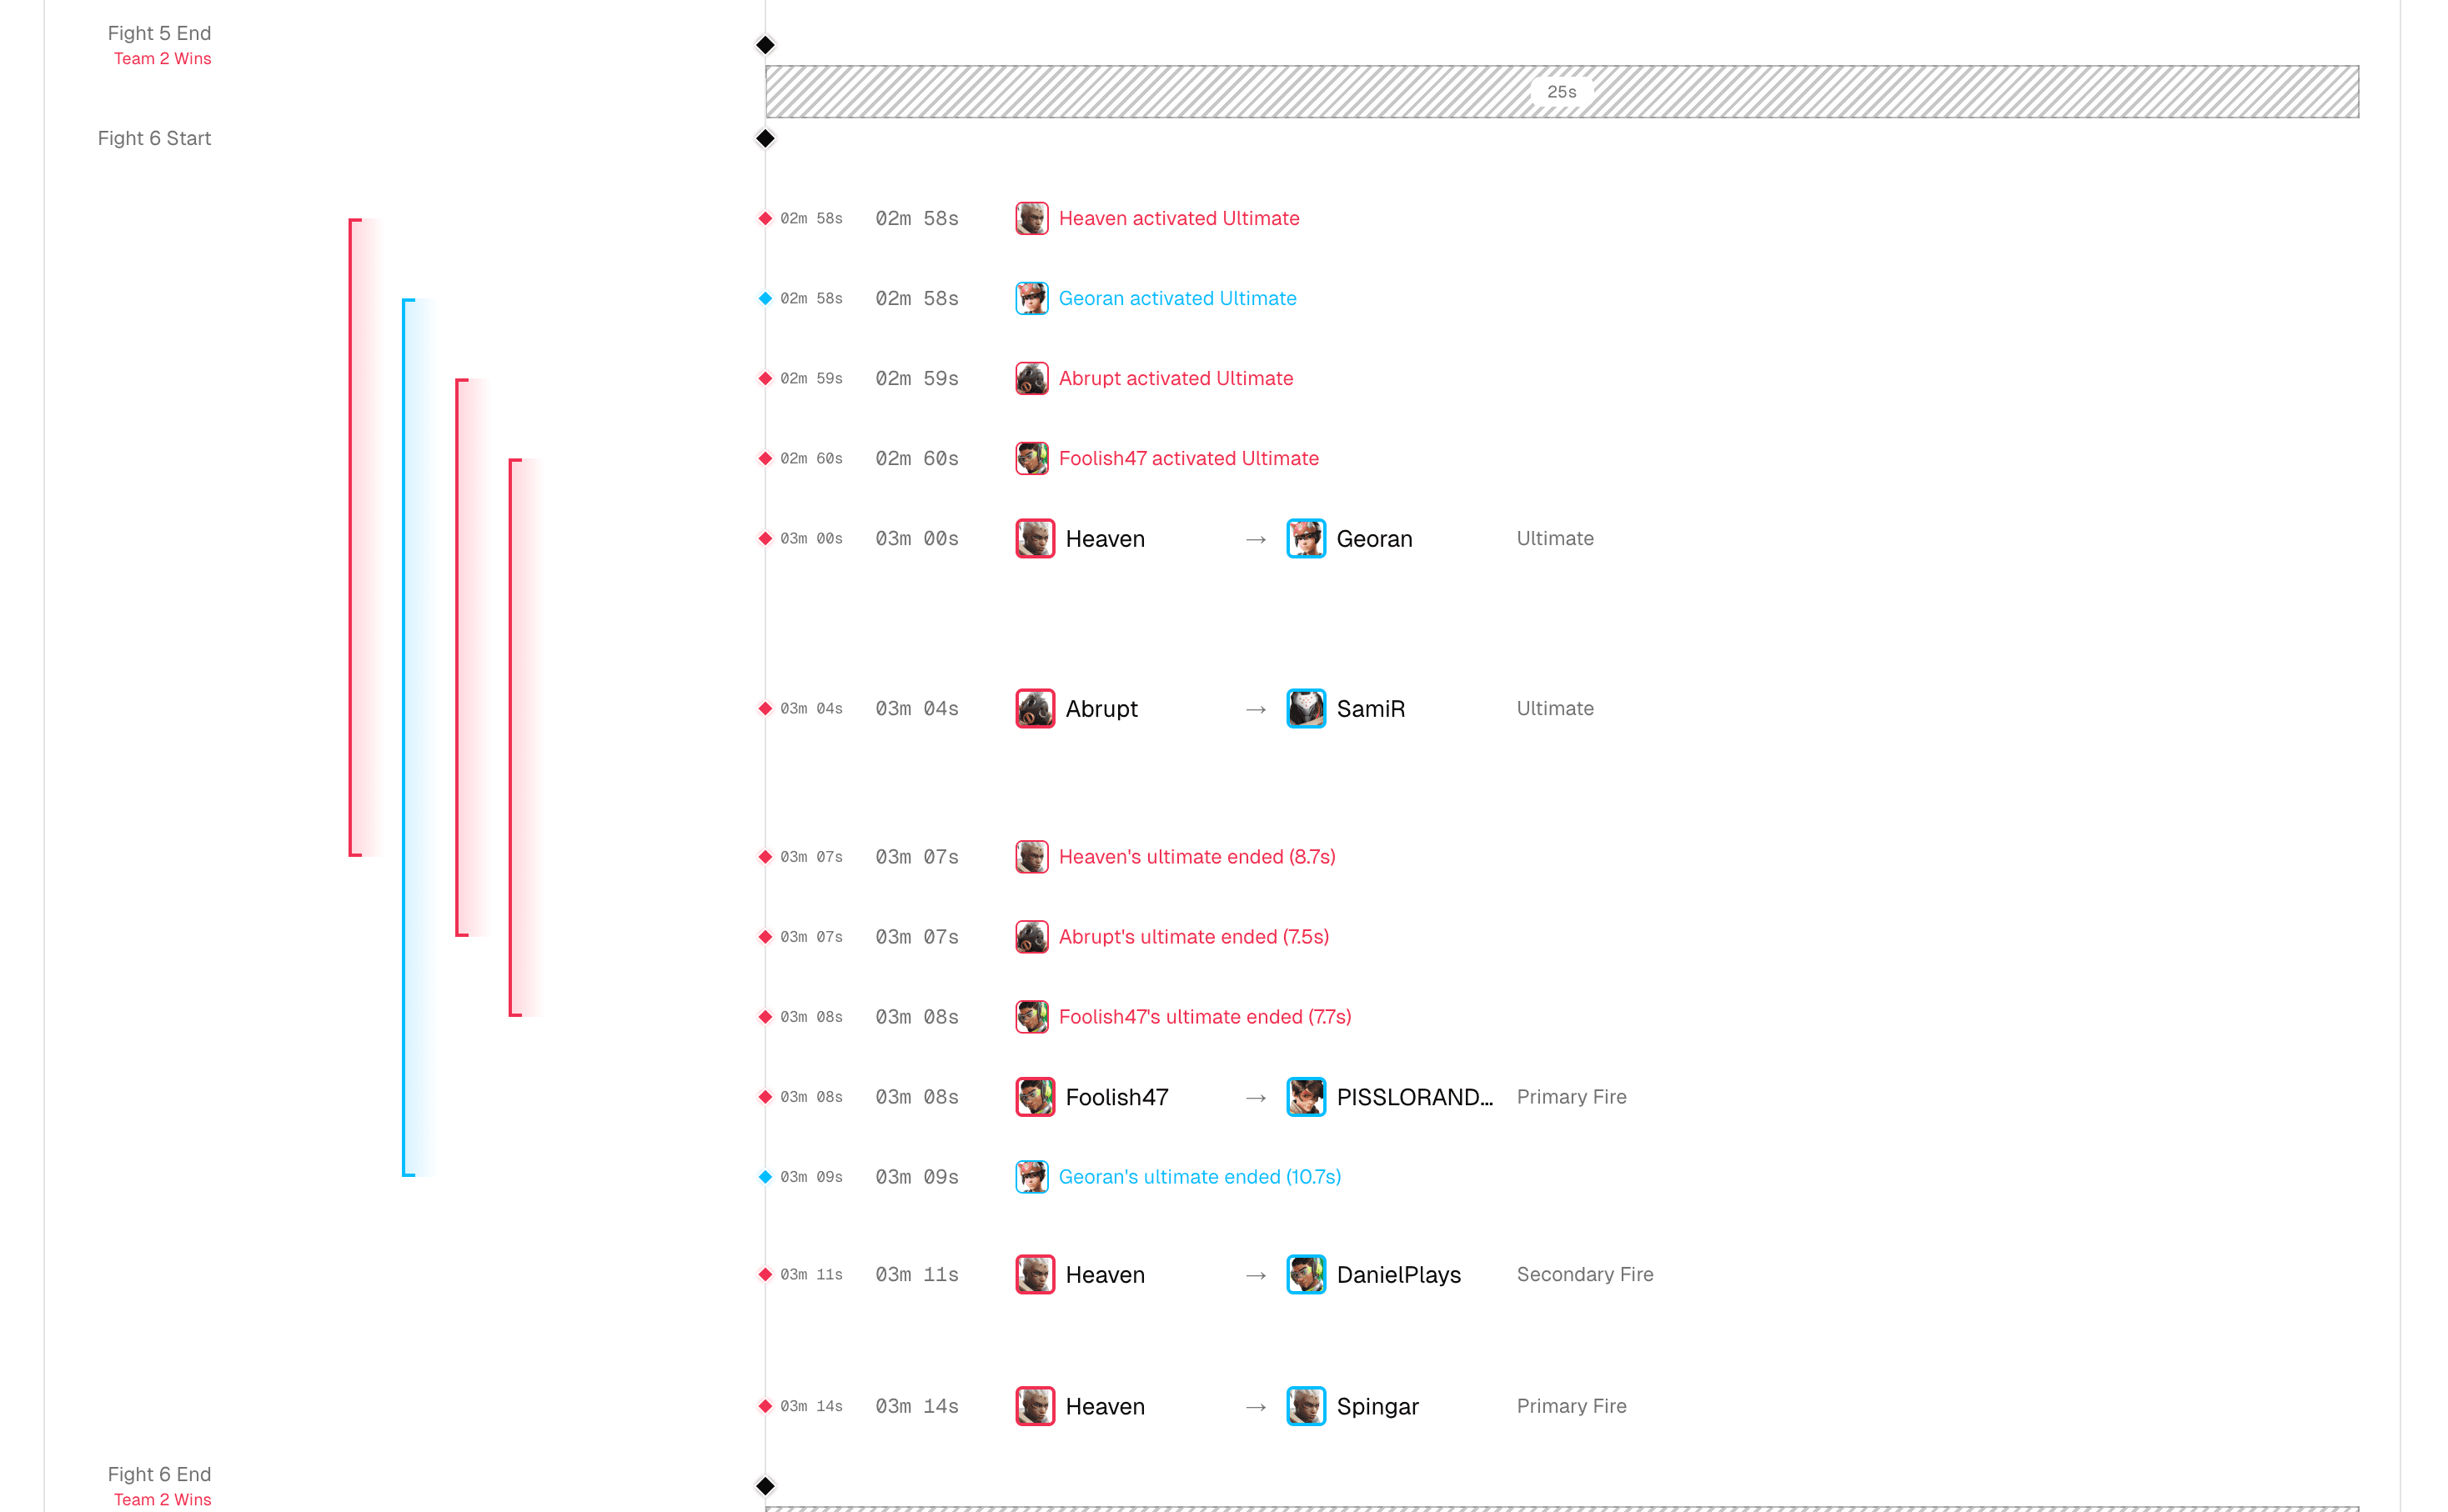
Parsertime killfeed visualization showing match eventsParsertime killfeed visualization showing match events

Rich data visualizations

Data that drives decisions

Charts, tables, and breakdowns that surface the stats that matter most to your coaching.
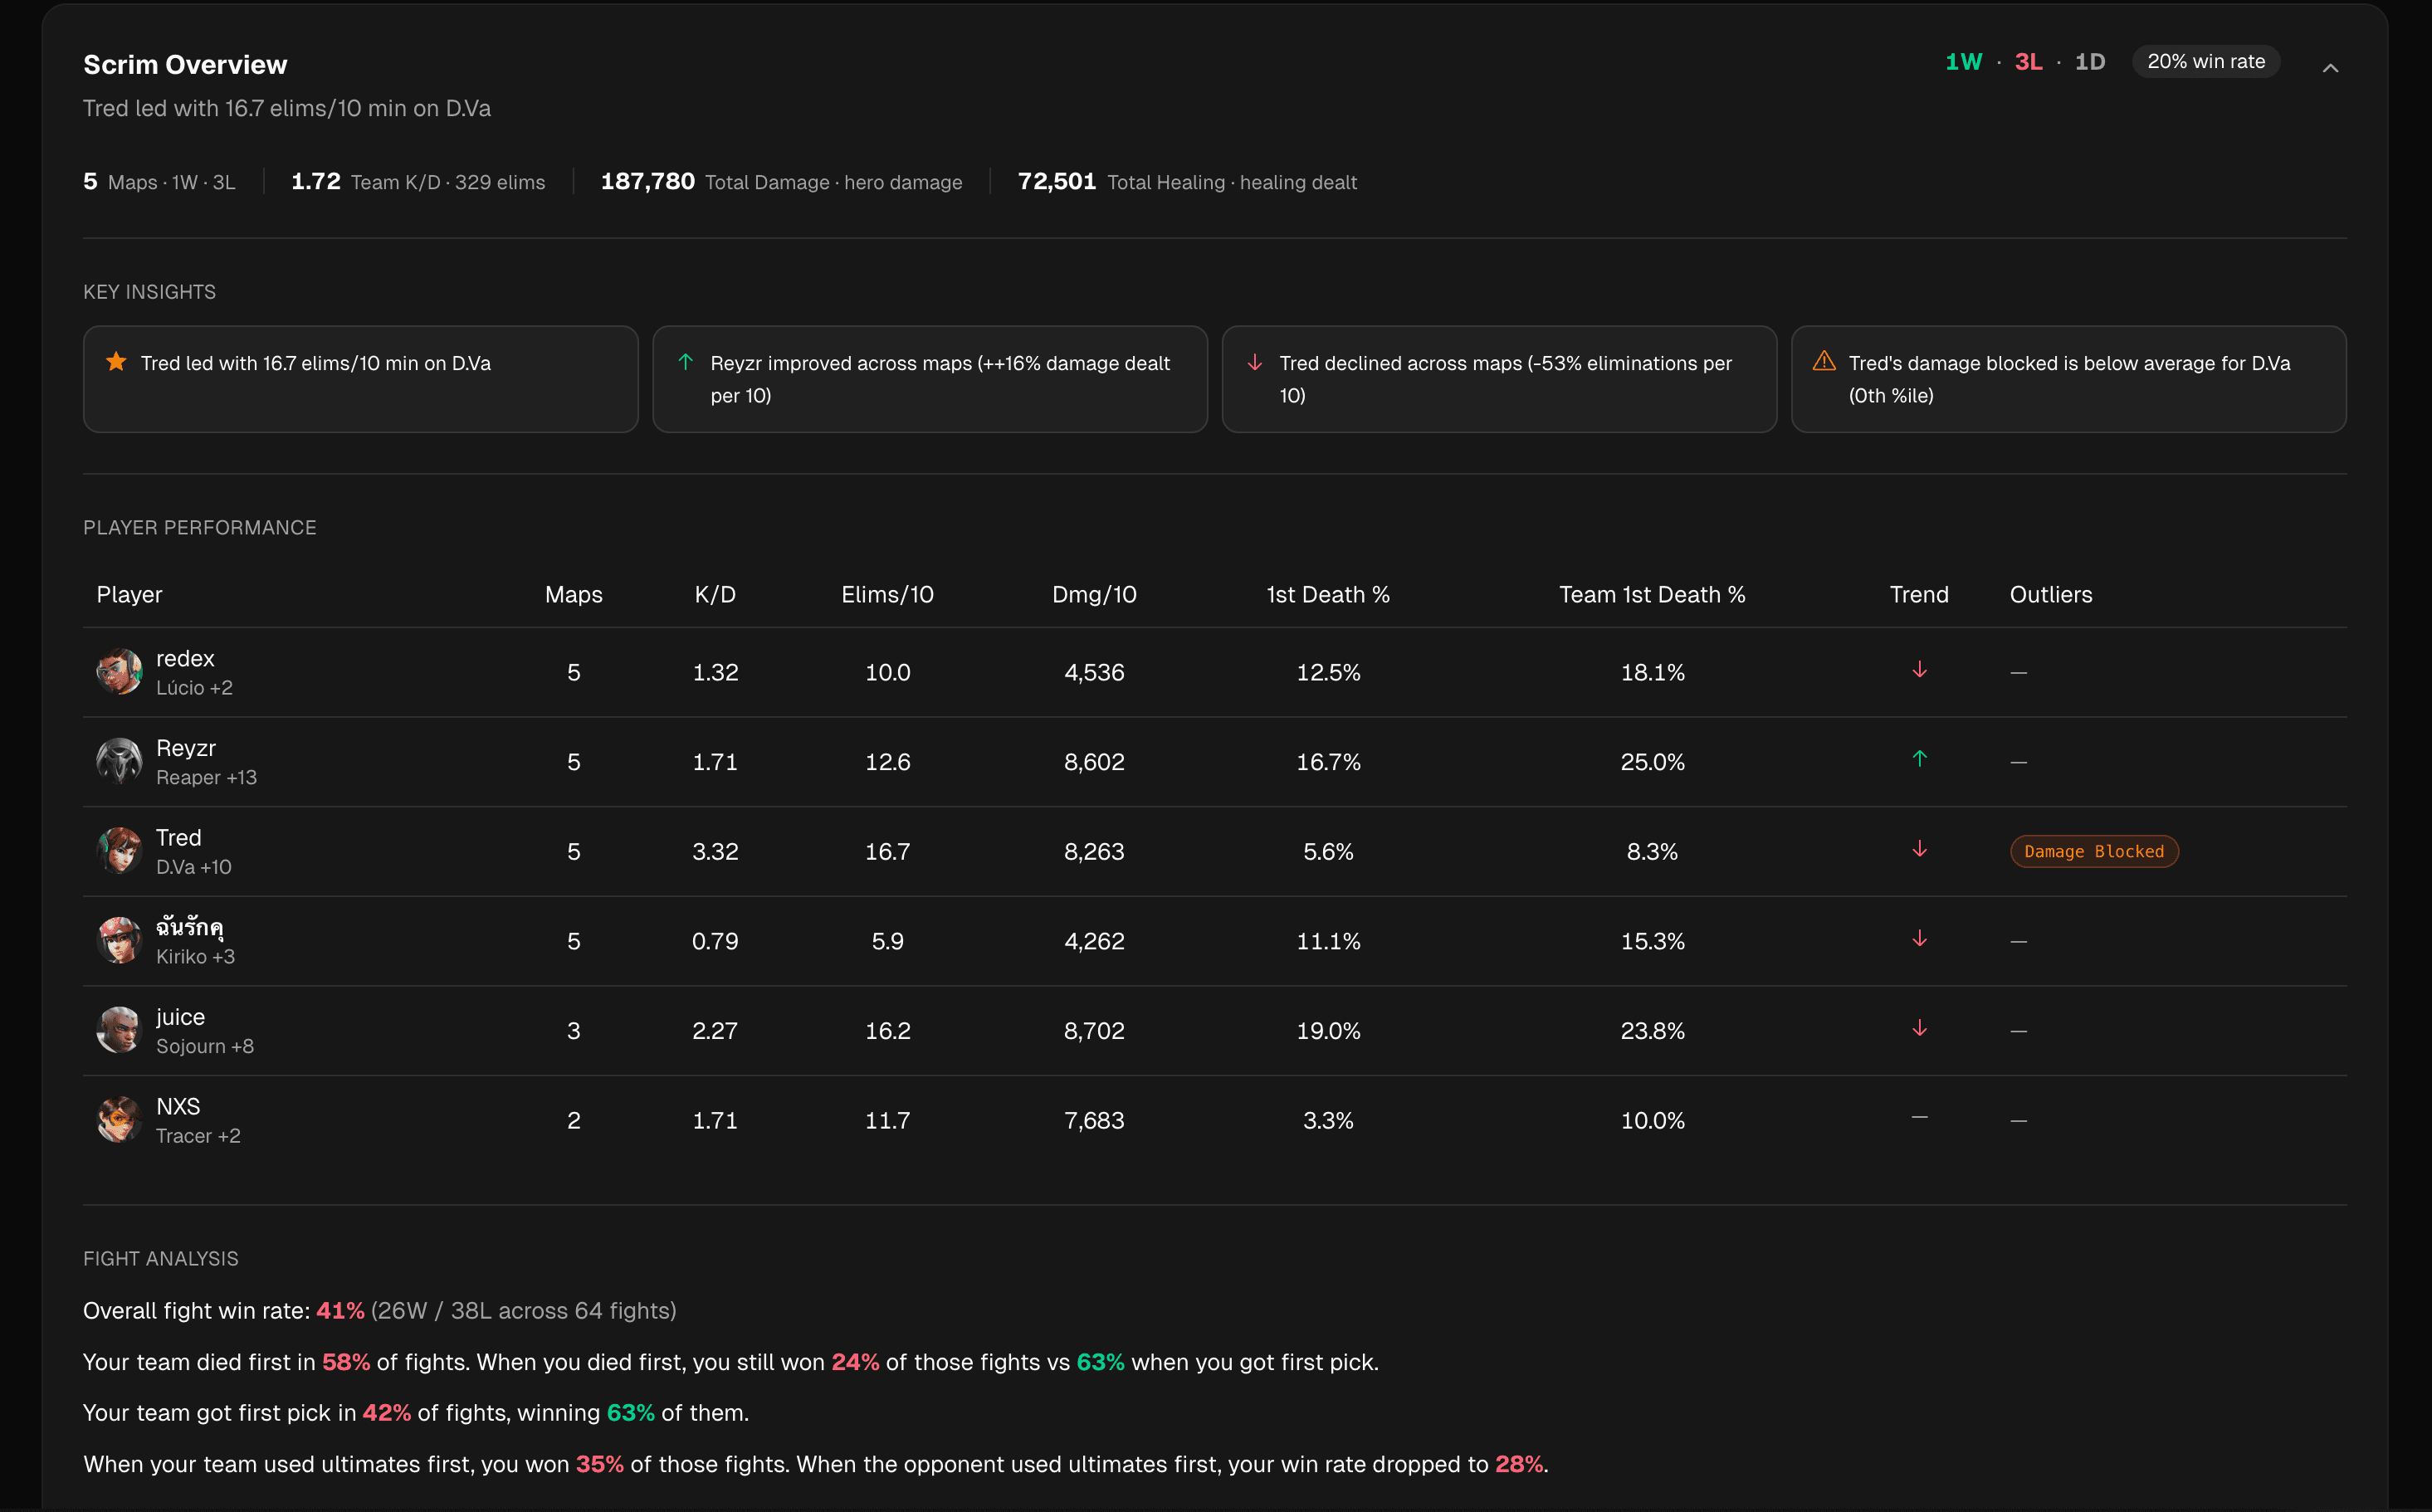
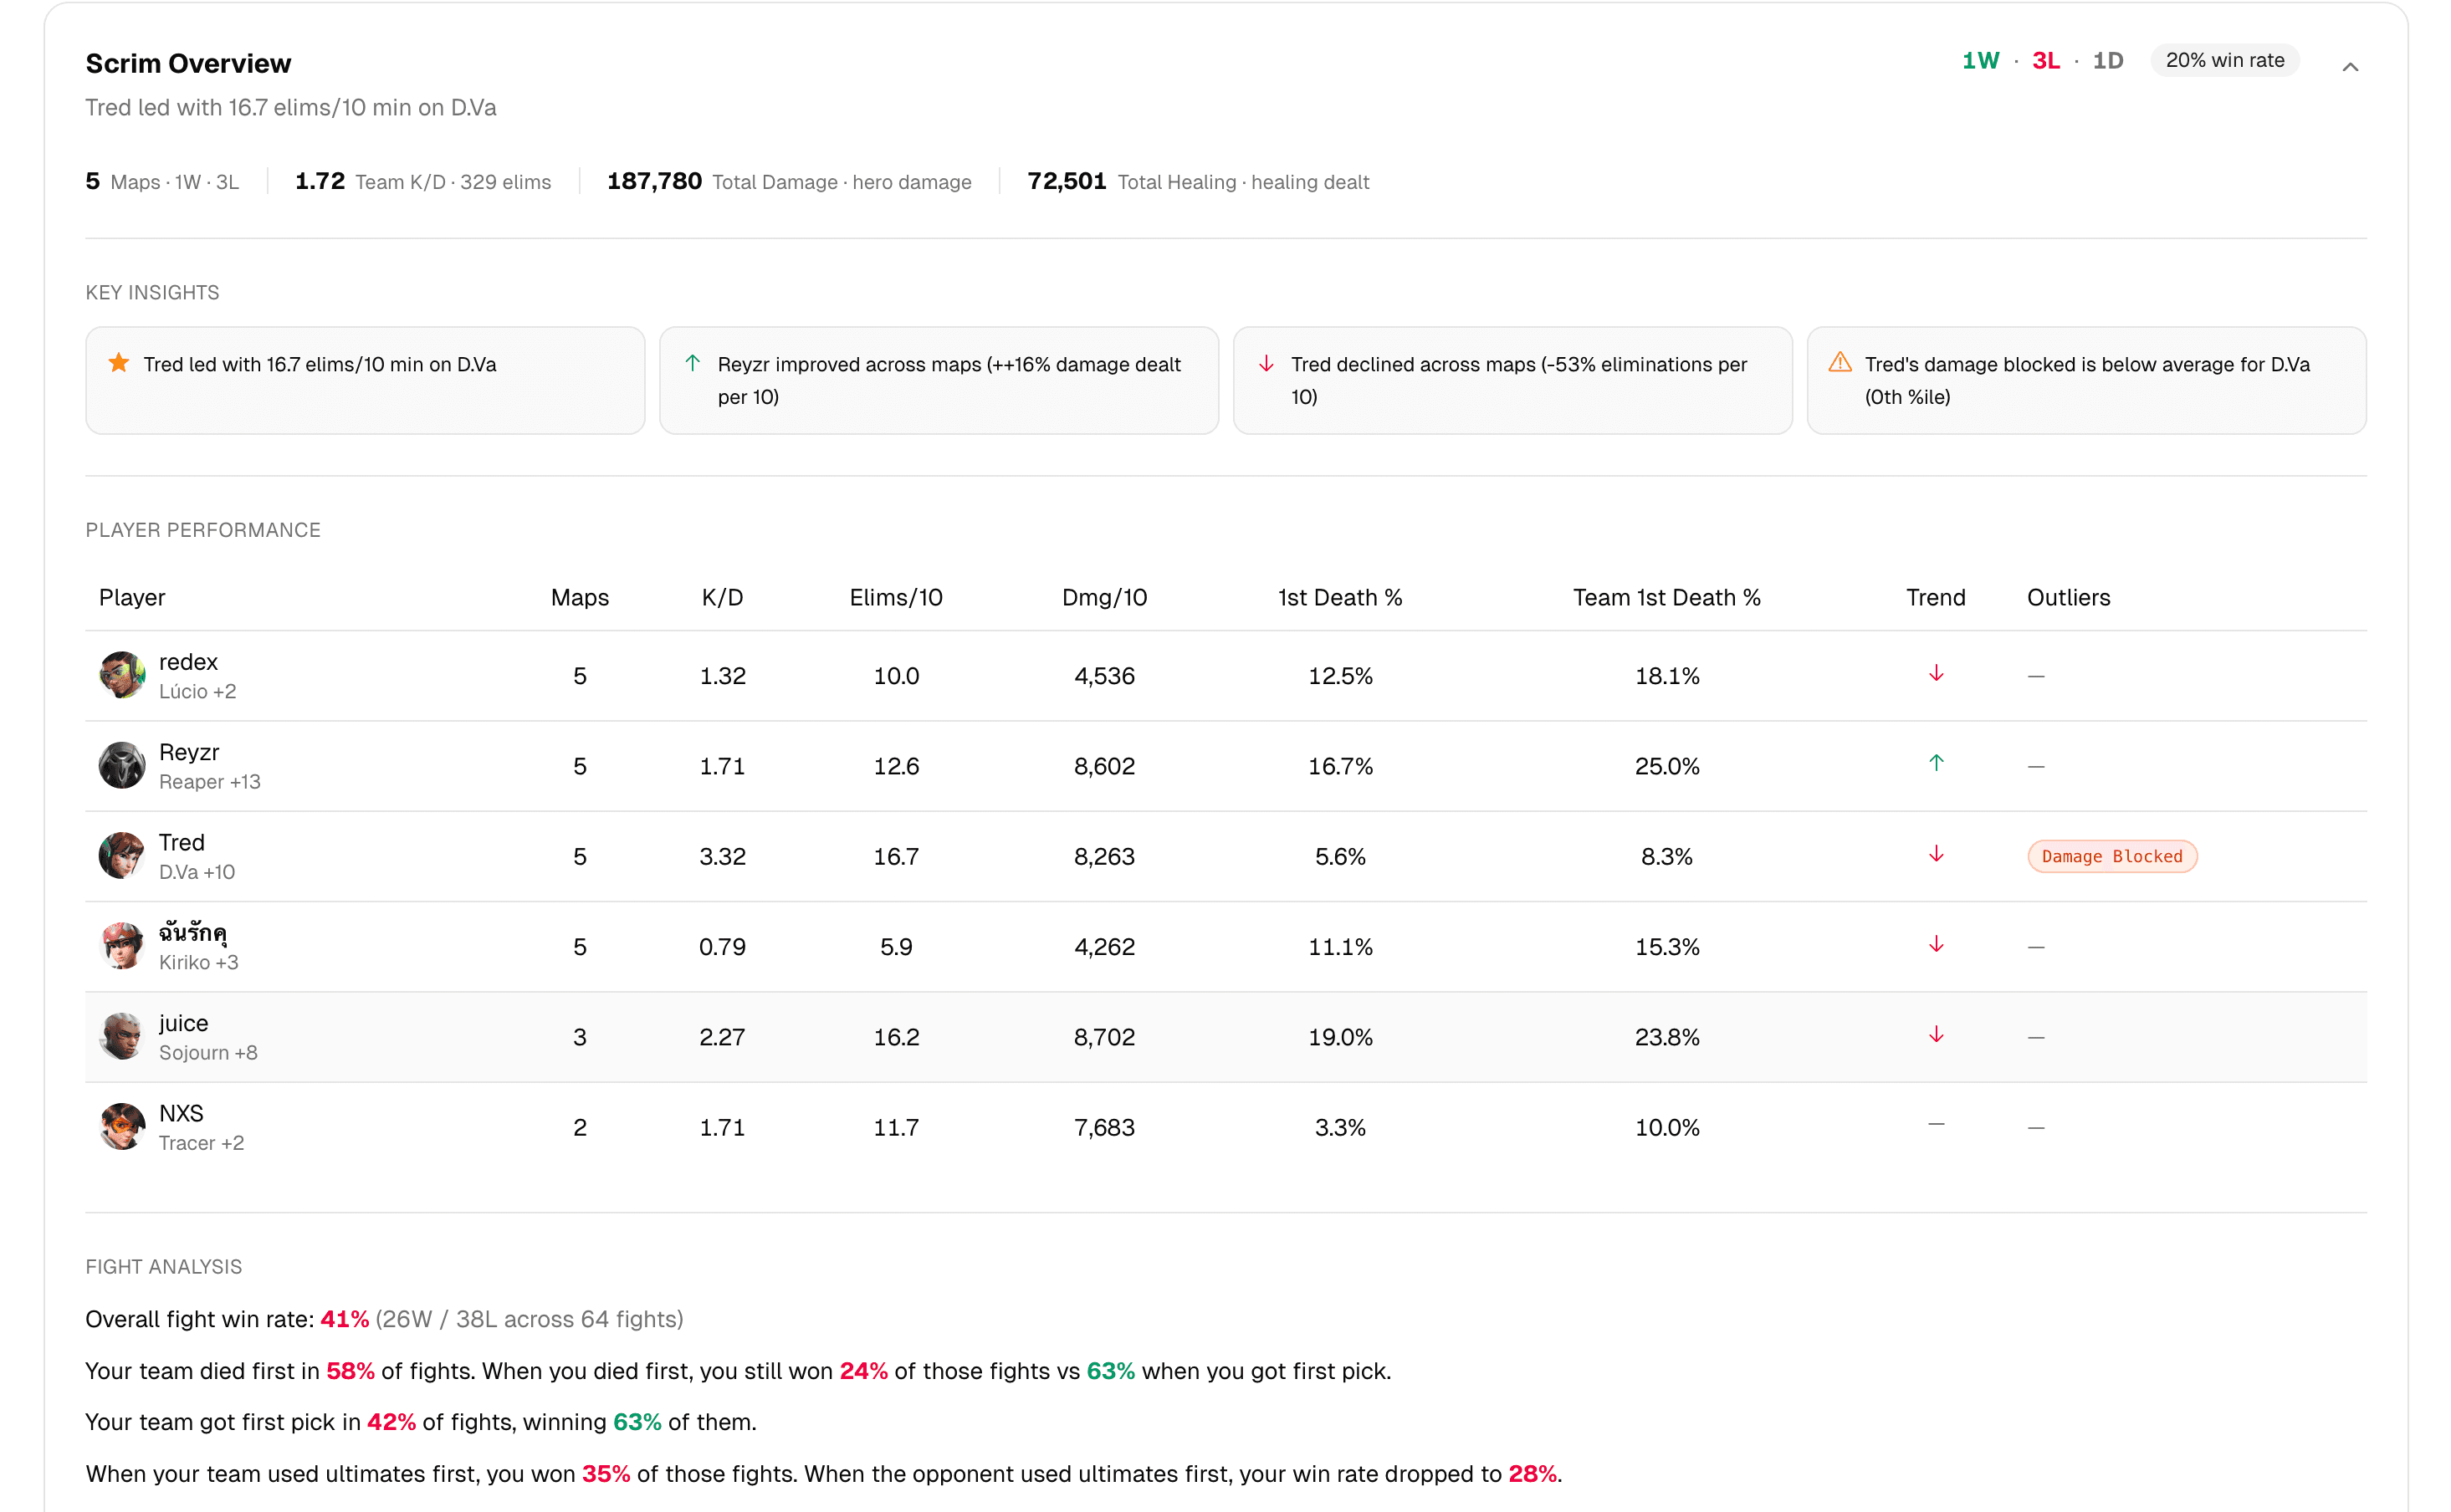
Parsertime scrim overview card with match resultsParsertime scrim overview card with match results

Scrim overview at a glance

How it works

From raw logs to coaching calls

Drop your Workshop logs in after the block. Parsertime parses every event, computes ratings and positioning, and turns the night's scrims into dashboards before VOD review starts.

Scrim logsYour dashboards
kings-row.log
oasis.log
suravasa.log
samoa.log
Parsertime
Parsertime
Team dashboards
Hero skill ratings
Replays & heatmaps
Trend lines

Get started in minutes.

parsertime.app
Create a teamCreate a team

Custom Hero Skill Rating

Know exactly where you stand

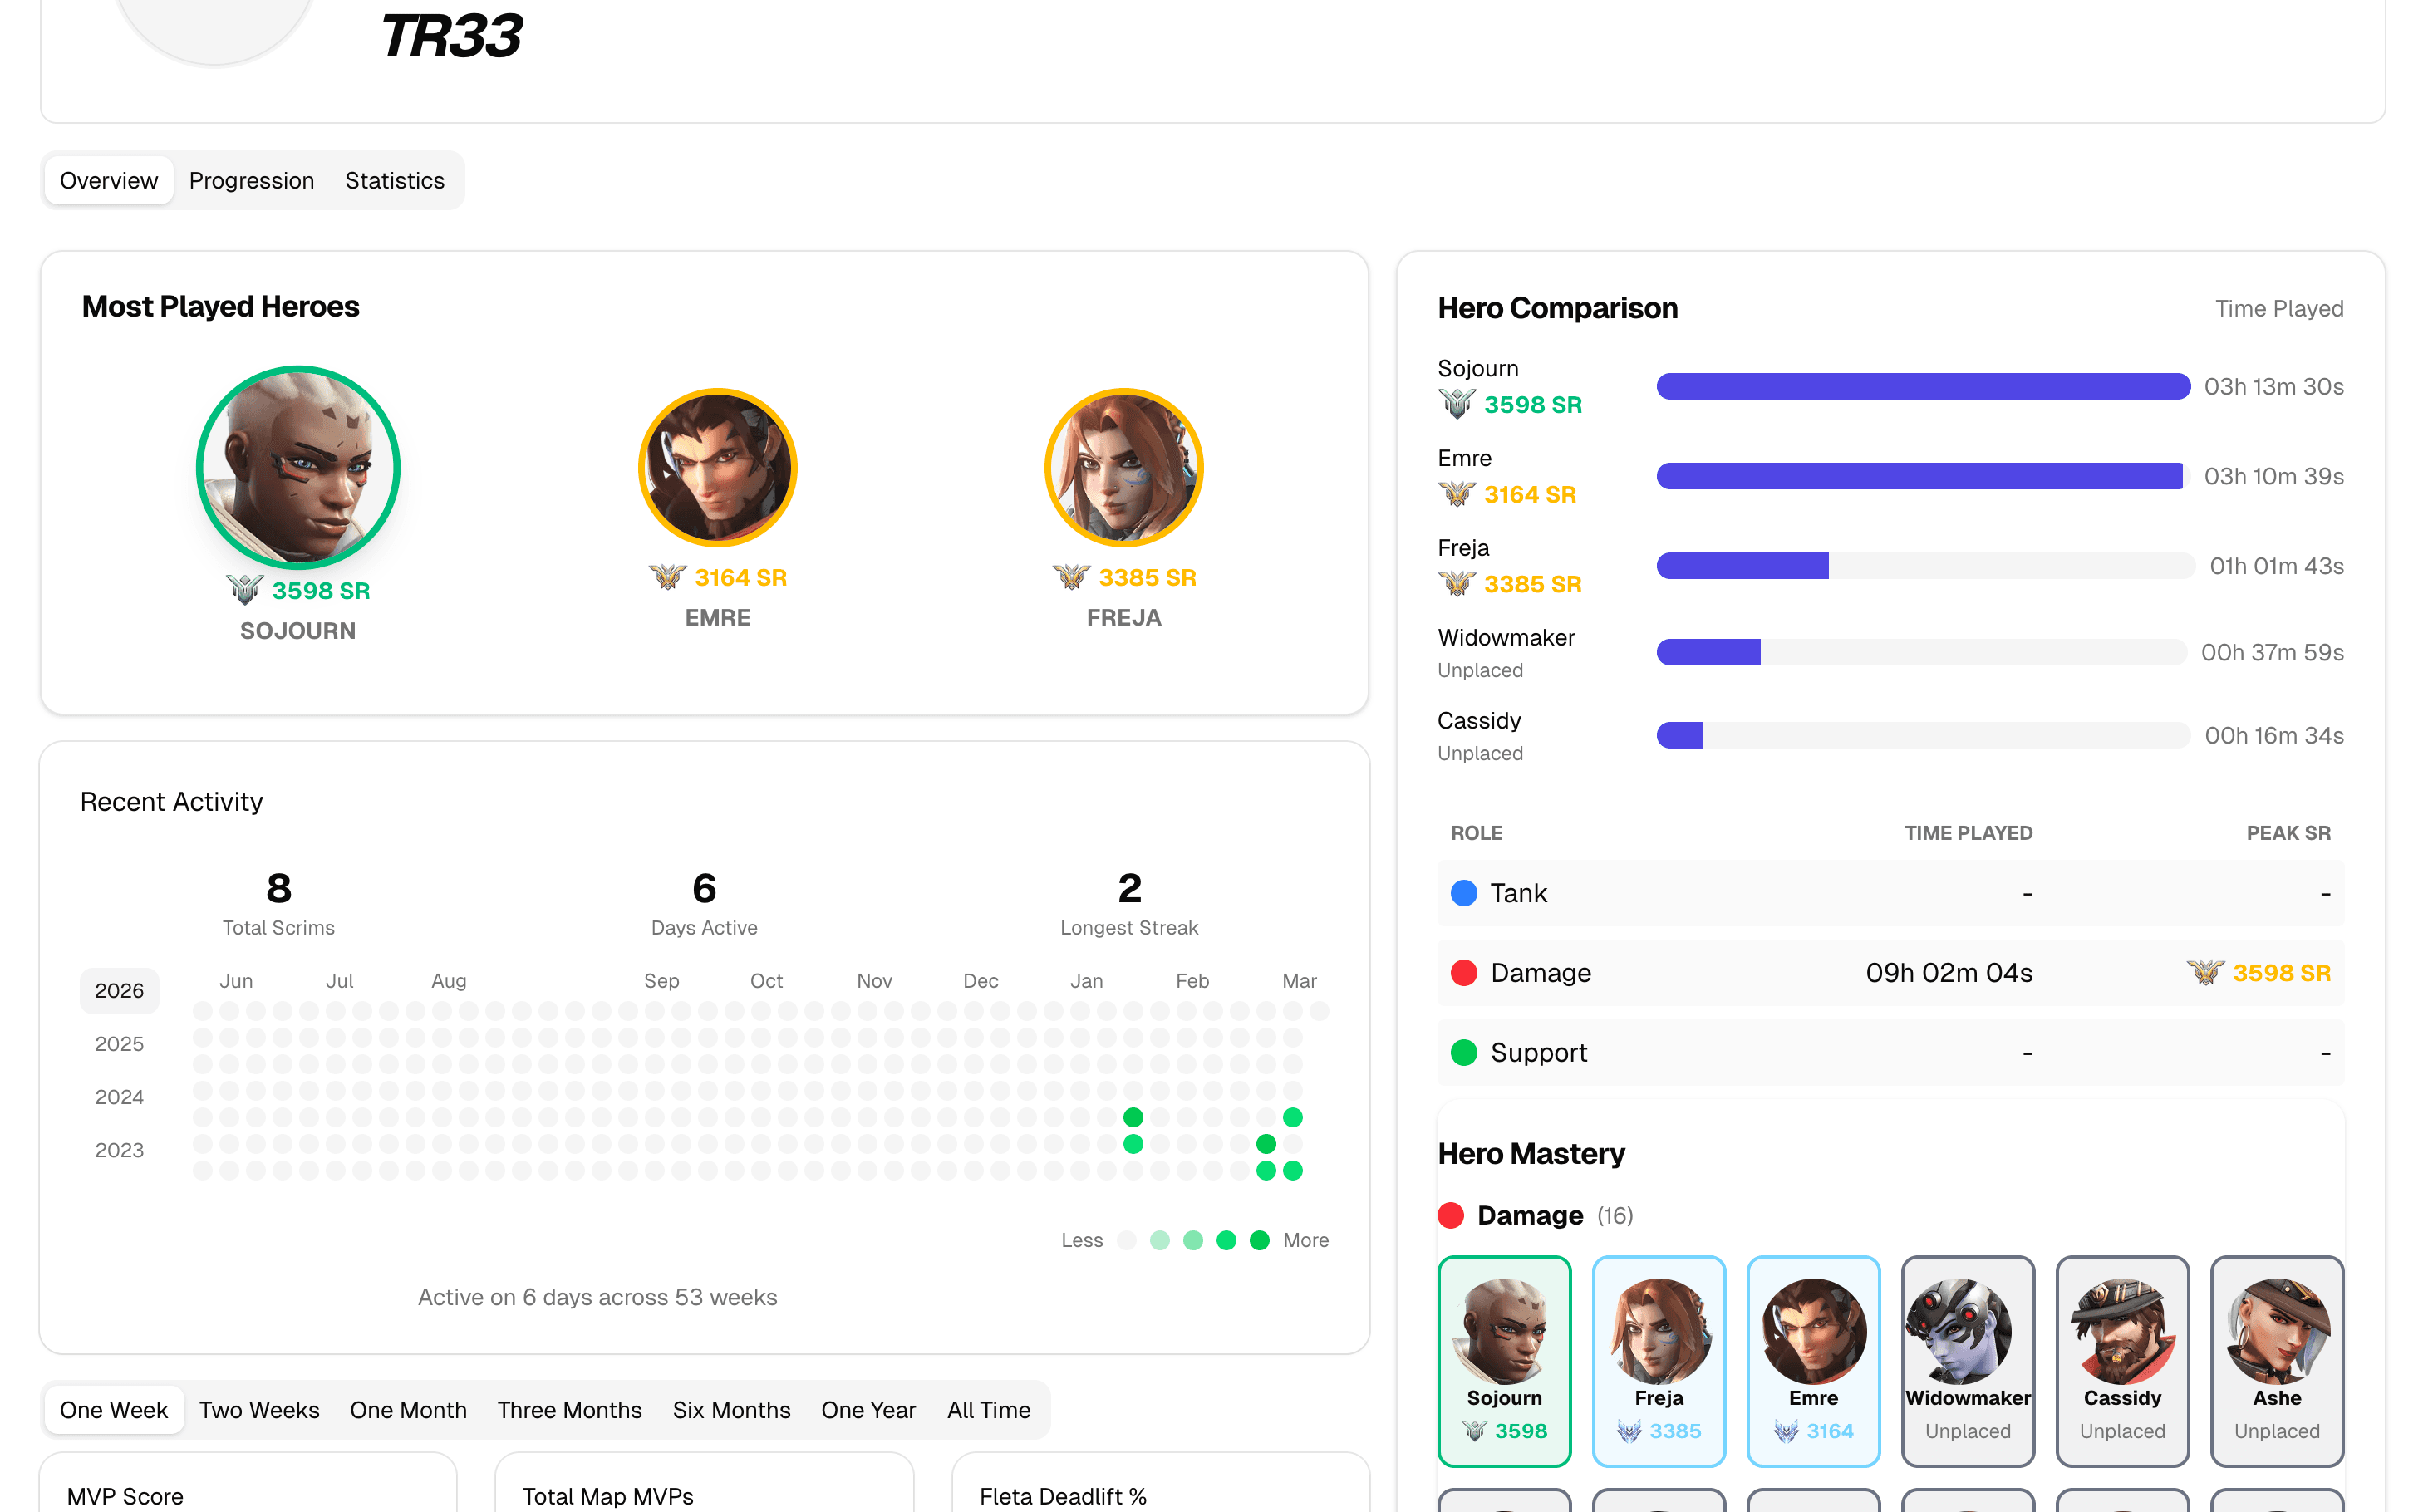
Our proprietary CSR system rates every player on a 1–5000 scale using statistical Z-scores across role-specific metrics. See your tier badge, track your improvement, and compete on the leaderboard.

  • Per-hero ratings Individual skill ratings for every hero you play, weighted by role-specific stats like eliminations, deaths, and healing.
  • Tier badges From Bronze to Champion — see your rank at a glance with visually distinct tier badges.
  • Population distribution Understand where you fall in the player population with bell curve distribution charts and percentile rankings.
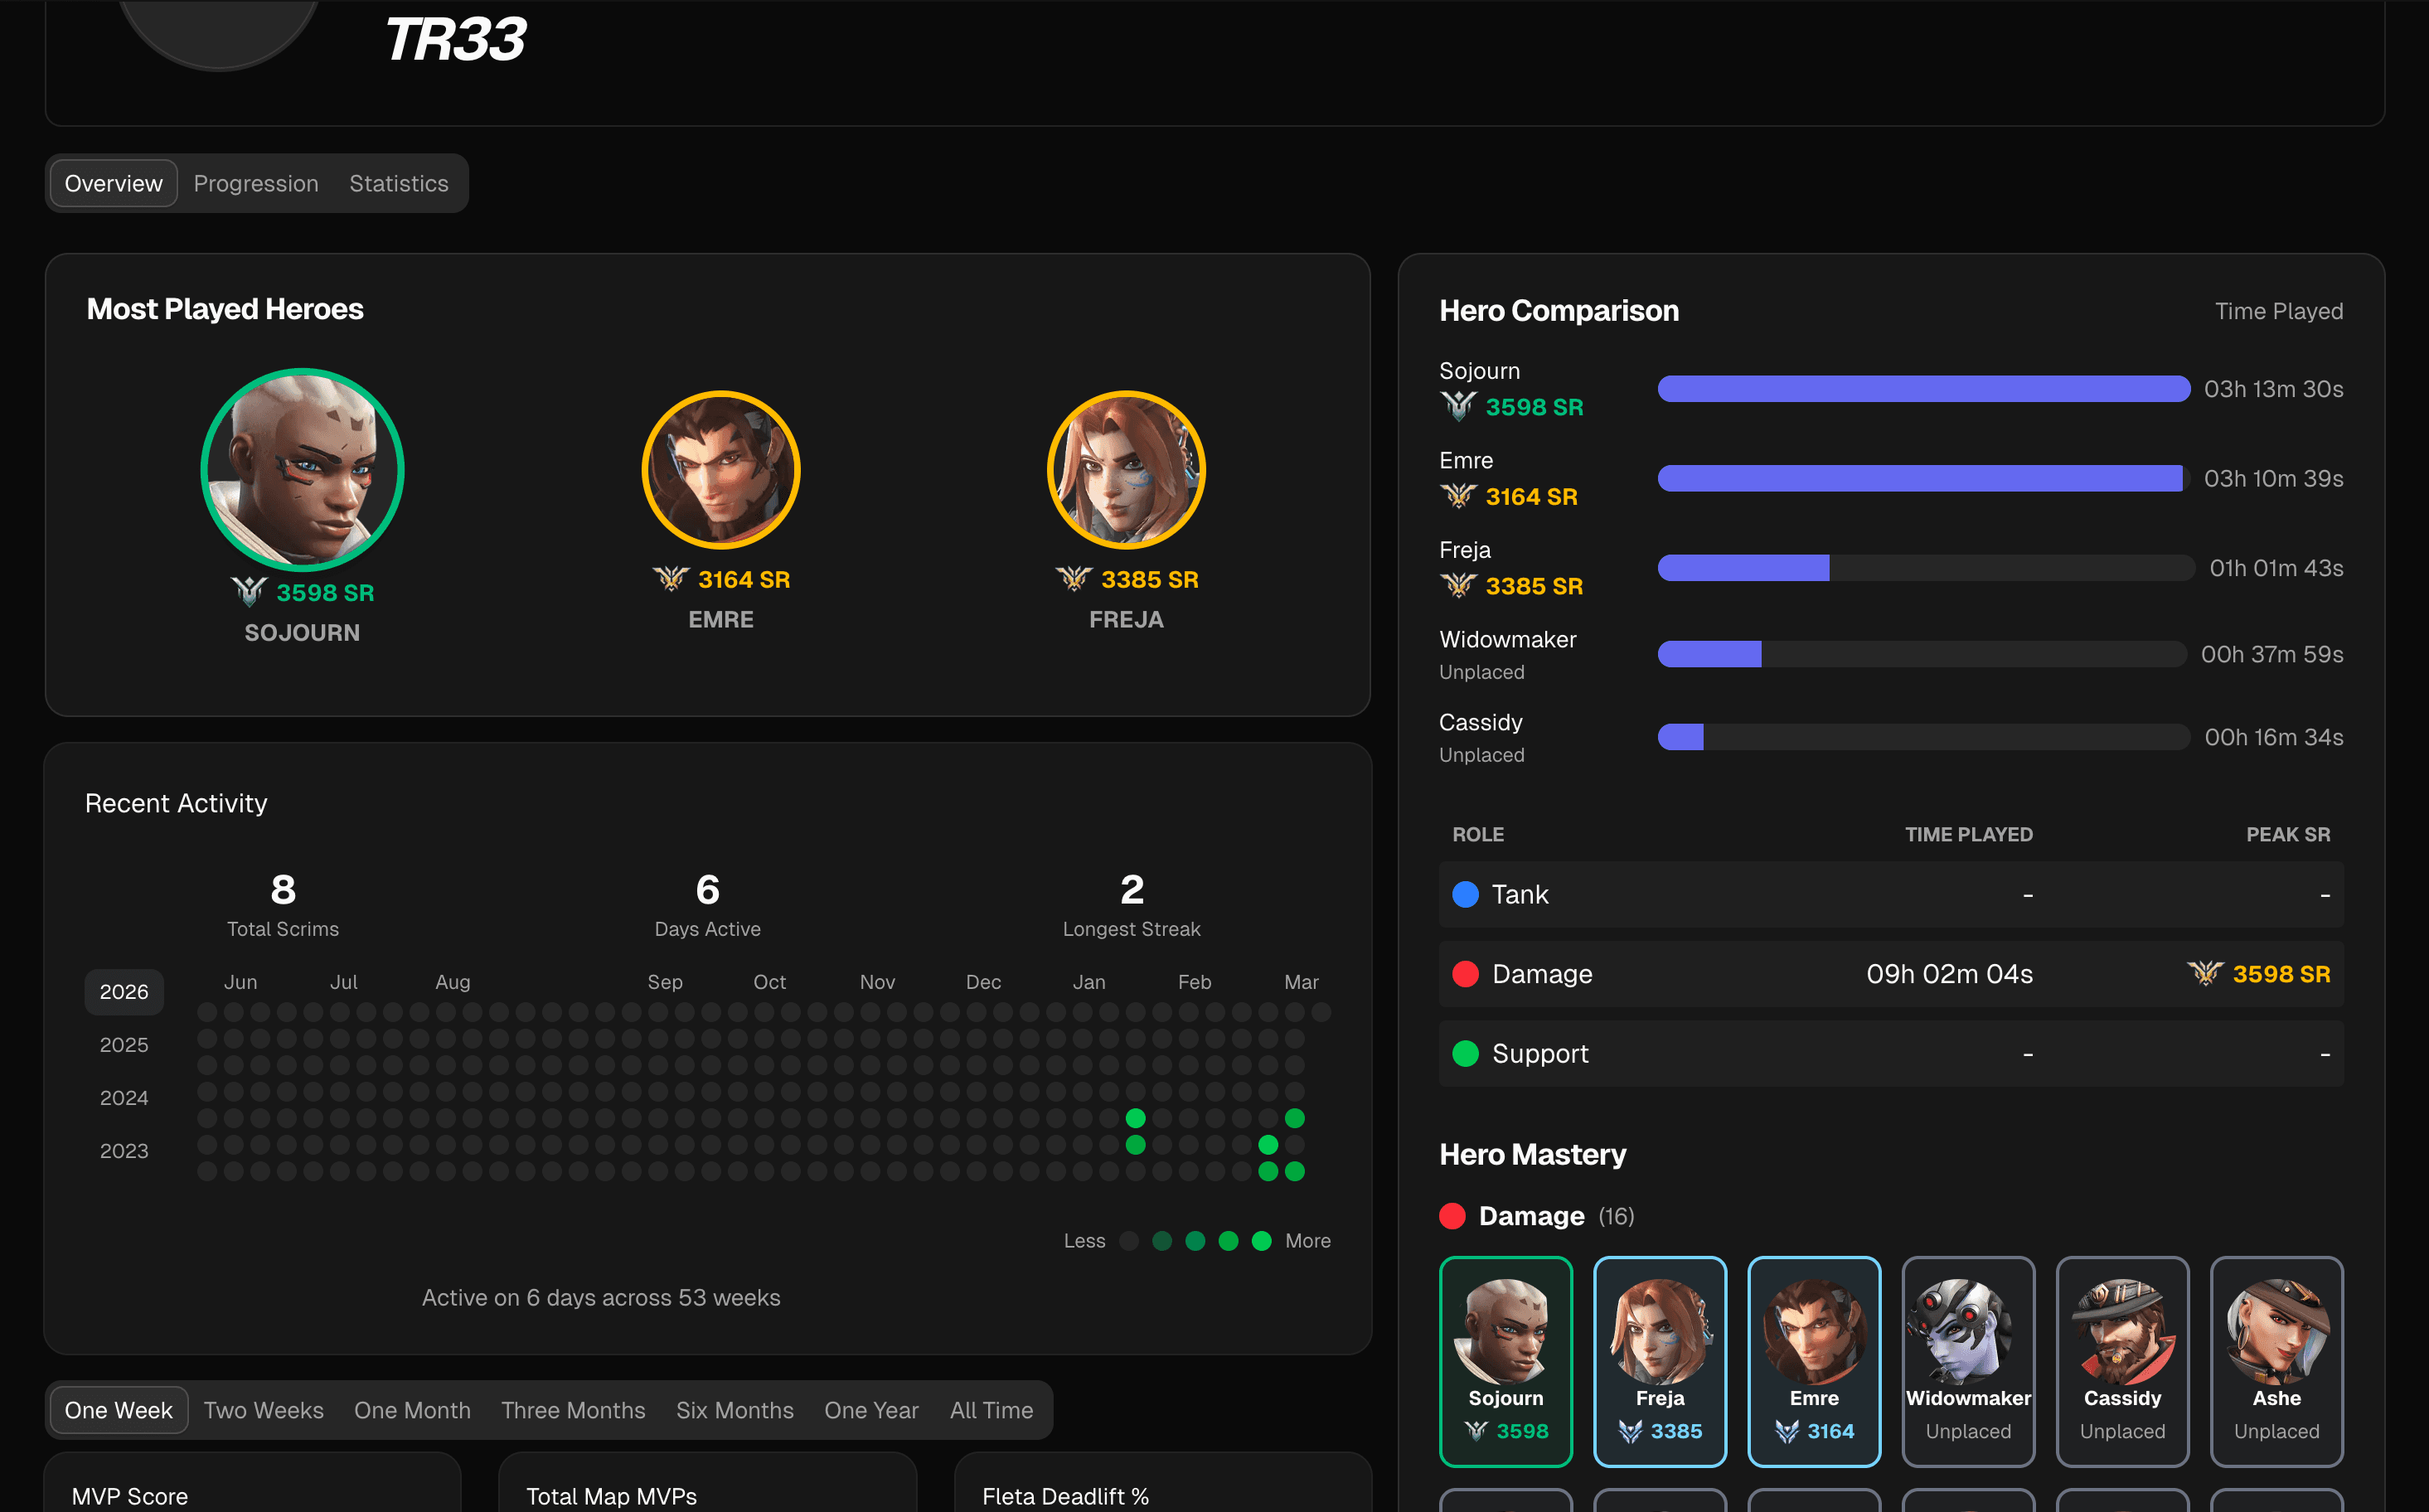
parsertime.app
Custom Hero Skill Rating screenshotCustom Hero Skill Rating screenshot

Team Analytics Dashboard

Eight dimensions of team performance

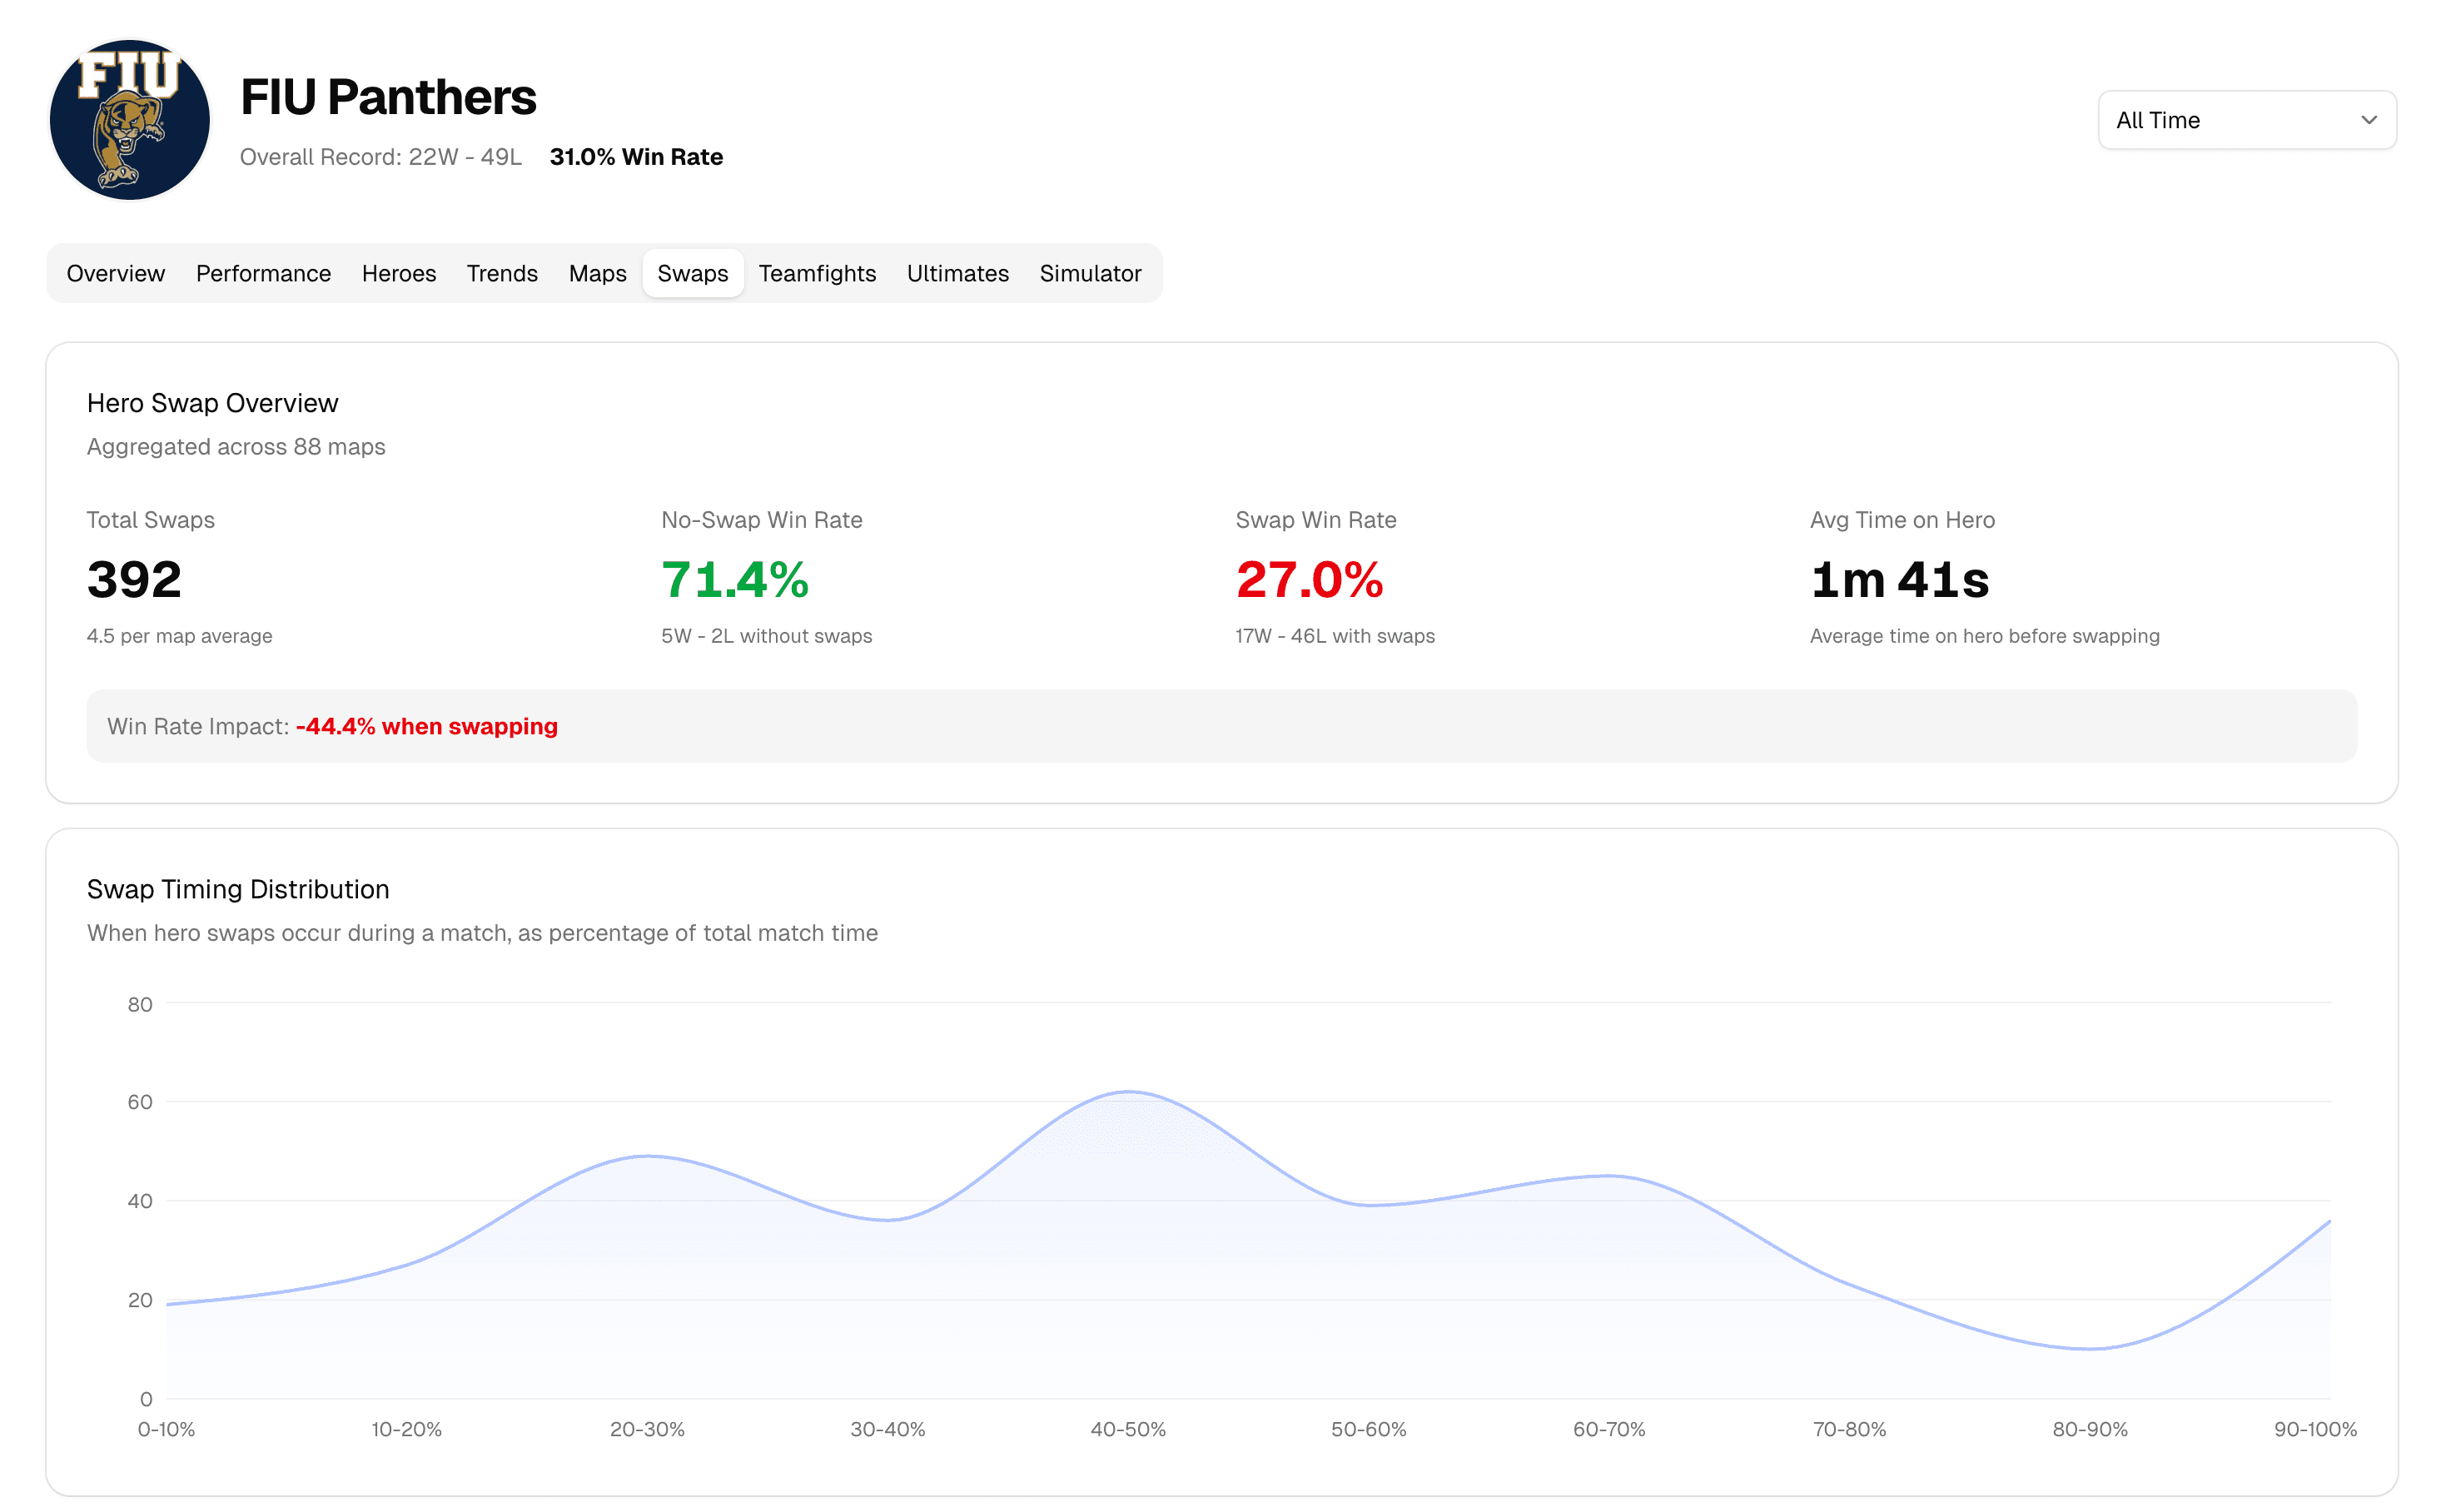
Dive deep into your team's performance with dedicated tabs for Overview, Performance, Heroes, Trends, Maps, Swaps, Teamfights, and Ultimates.

  • Rich visualizations Radar charts, heatmaps, trend lines, and map galleries that make patterns obvious at a glance.
  • Role balance analysis Compare Tank, Damage, and Support performance with normalized radar charts and find your team's strengths.
  • Winrate trends Track your team's trajectory week over week with trend lines that show exactly what's working.
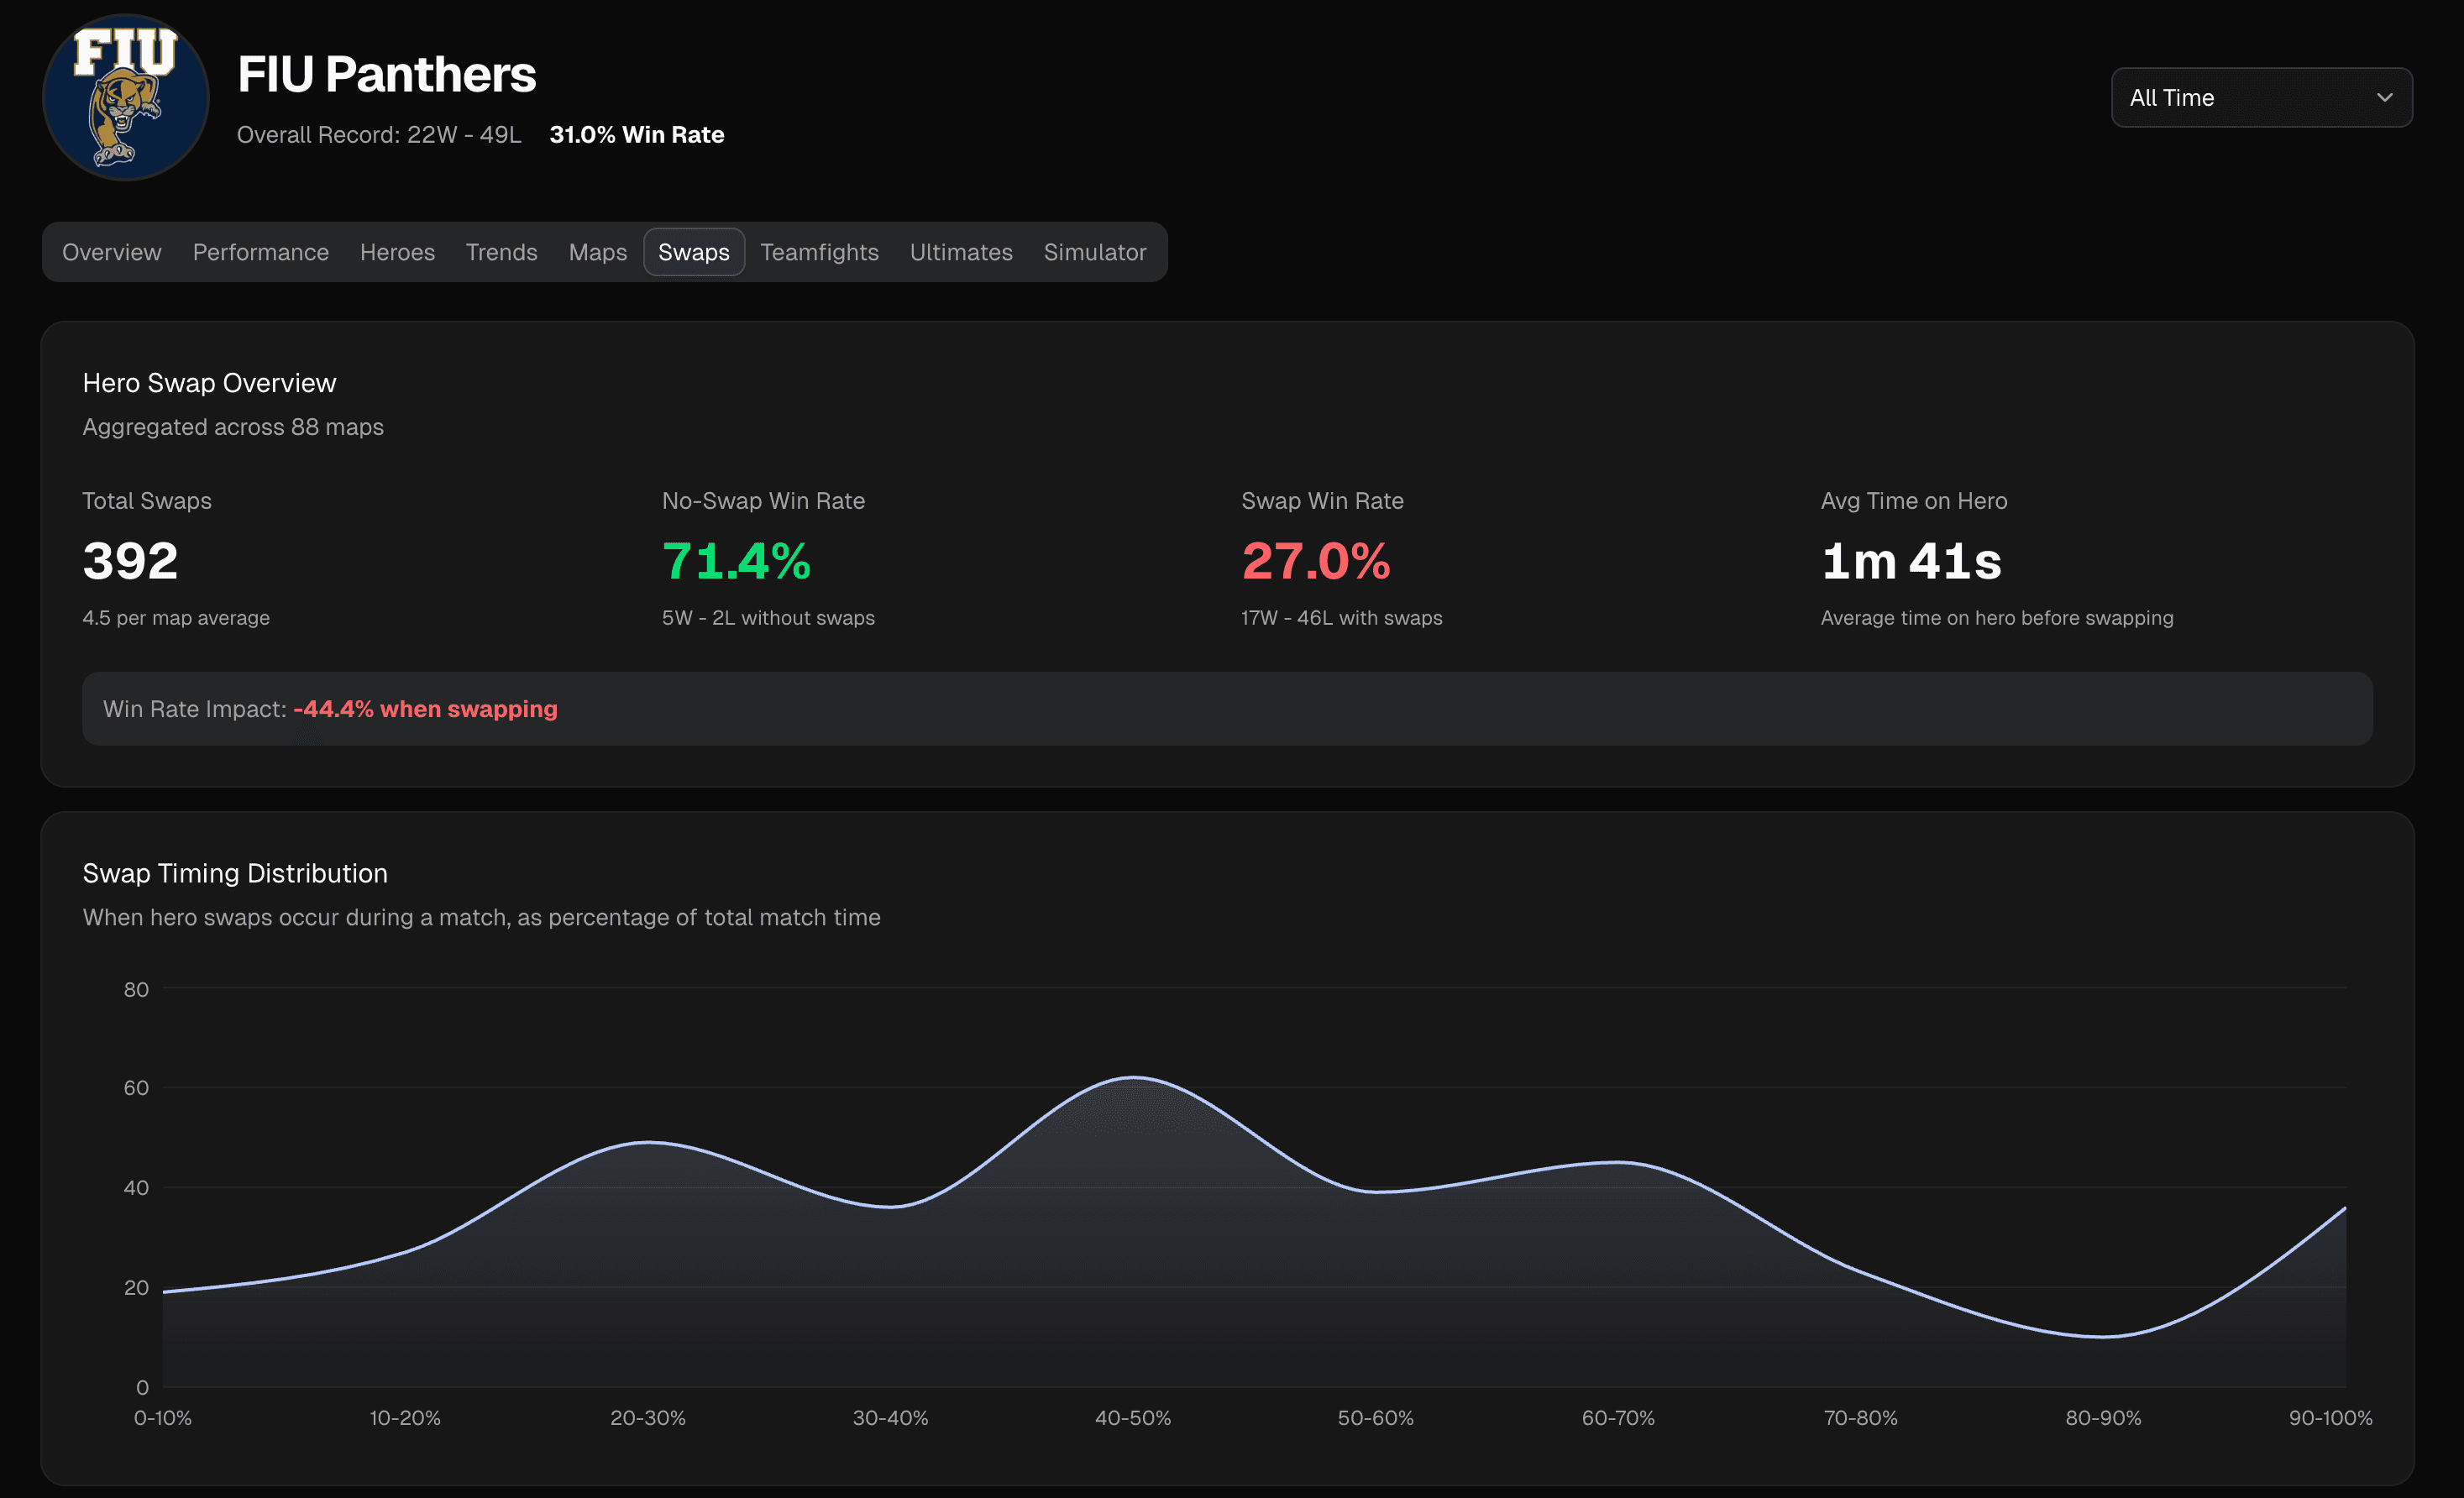
parsertime.app
Team Analytics Dashboard screenshotTeam Analytics Dashboard screenshot

5 out of 5 stars

Your scrims hold the answers.
Start coaching with data today.

Create a team, upload your first scrim, and see results in minutes. Free to get started — no credit card required.
Start coaching with dataSee how it works →

Footer

XBlueskyGitHub

© 2024–2026 lux.dev. All rights reserved.

Damage and kill density heatmap rendered over King's Row

Positional averages · Last 10 scrims

Engagement distance
11.2m▲ 0.8m
High ground kill %
38%▲ 5%
Isolation death %
9%▼ 3%

Map replay viewer

Scrub through any teamfight in a top-down view. Player paths, ult timings, and kill events plotted on calibrated map images.

Heatmaps

Kill, death, and presence density rendered per map and side. See exactly where fights are won and lost.

Positional averages

Engagement distance, high ground kill rate, isolation deaths: positioning metrics averaged across scrims and trended over time.

Every metric, one card

See map results, match time, first pick rates, and more on a single card.

Your whole team, one place

No more spreadsheets

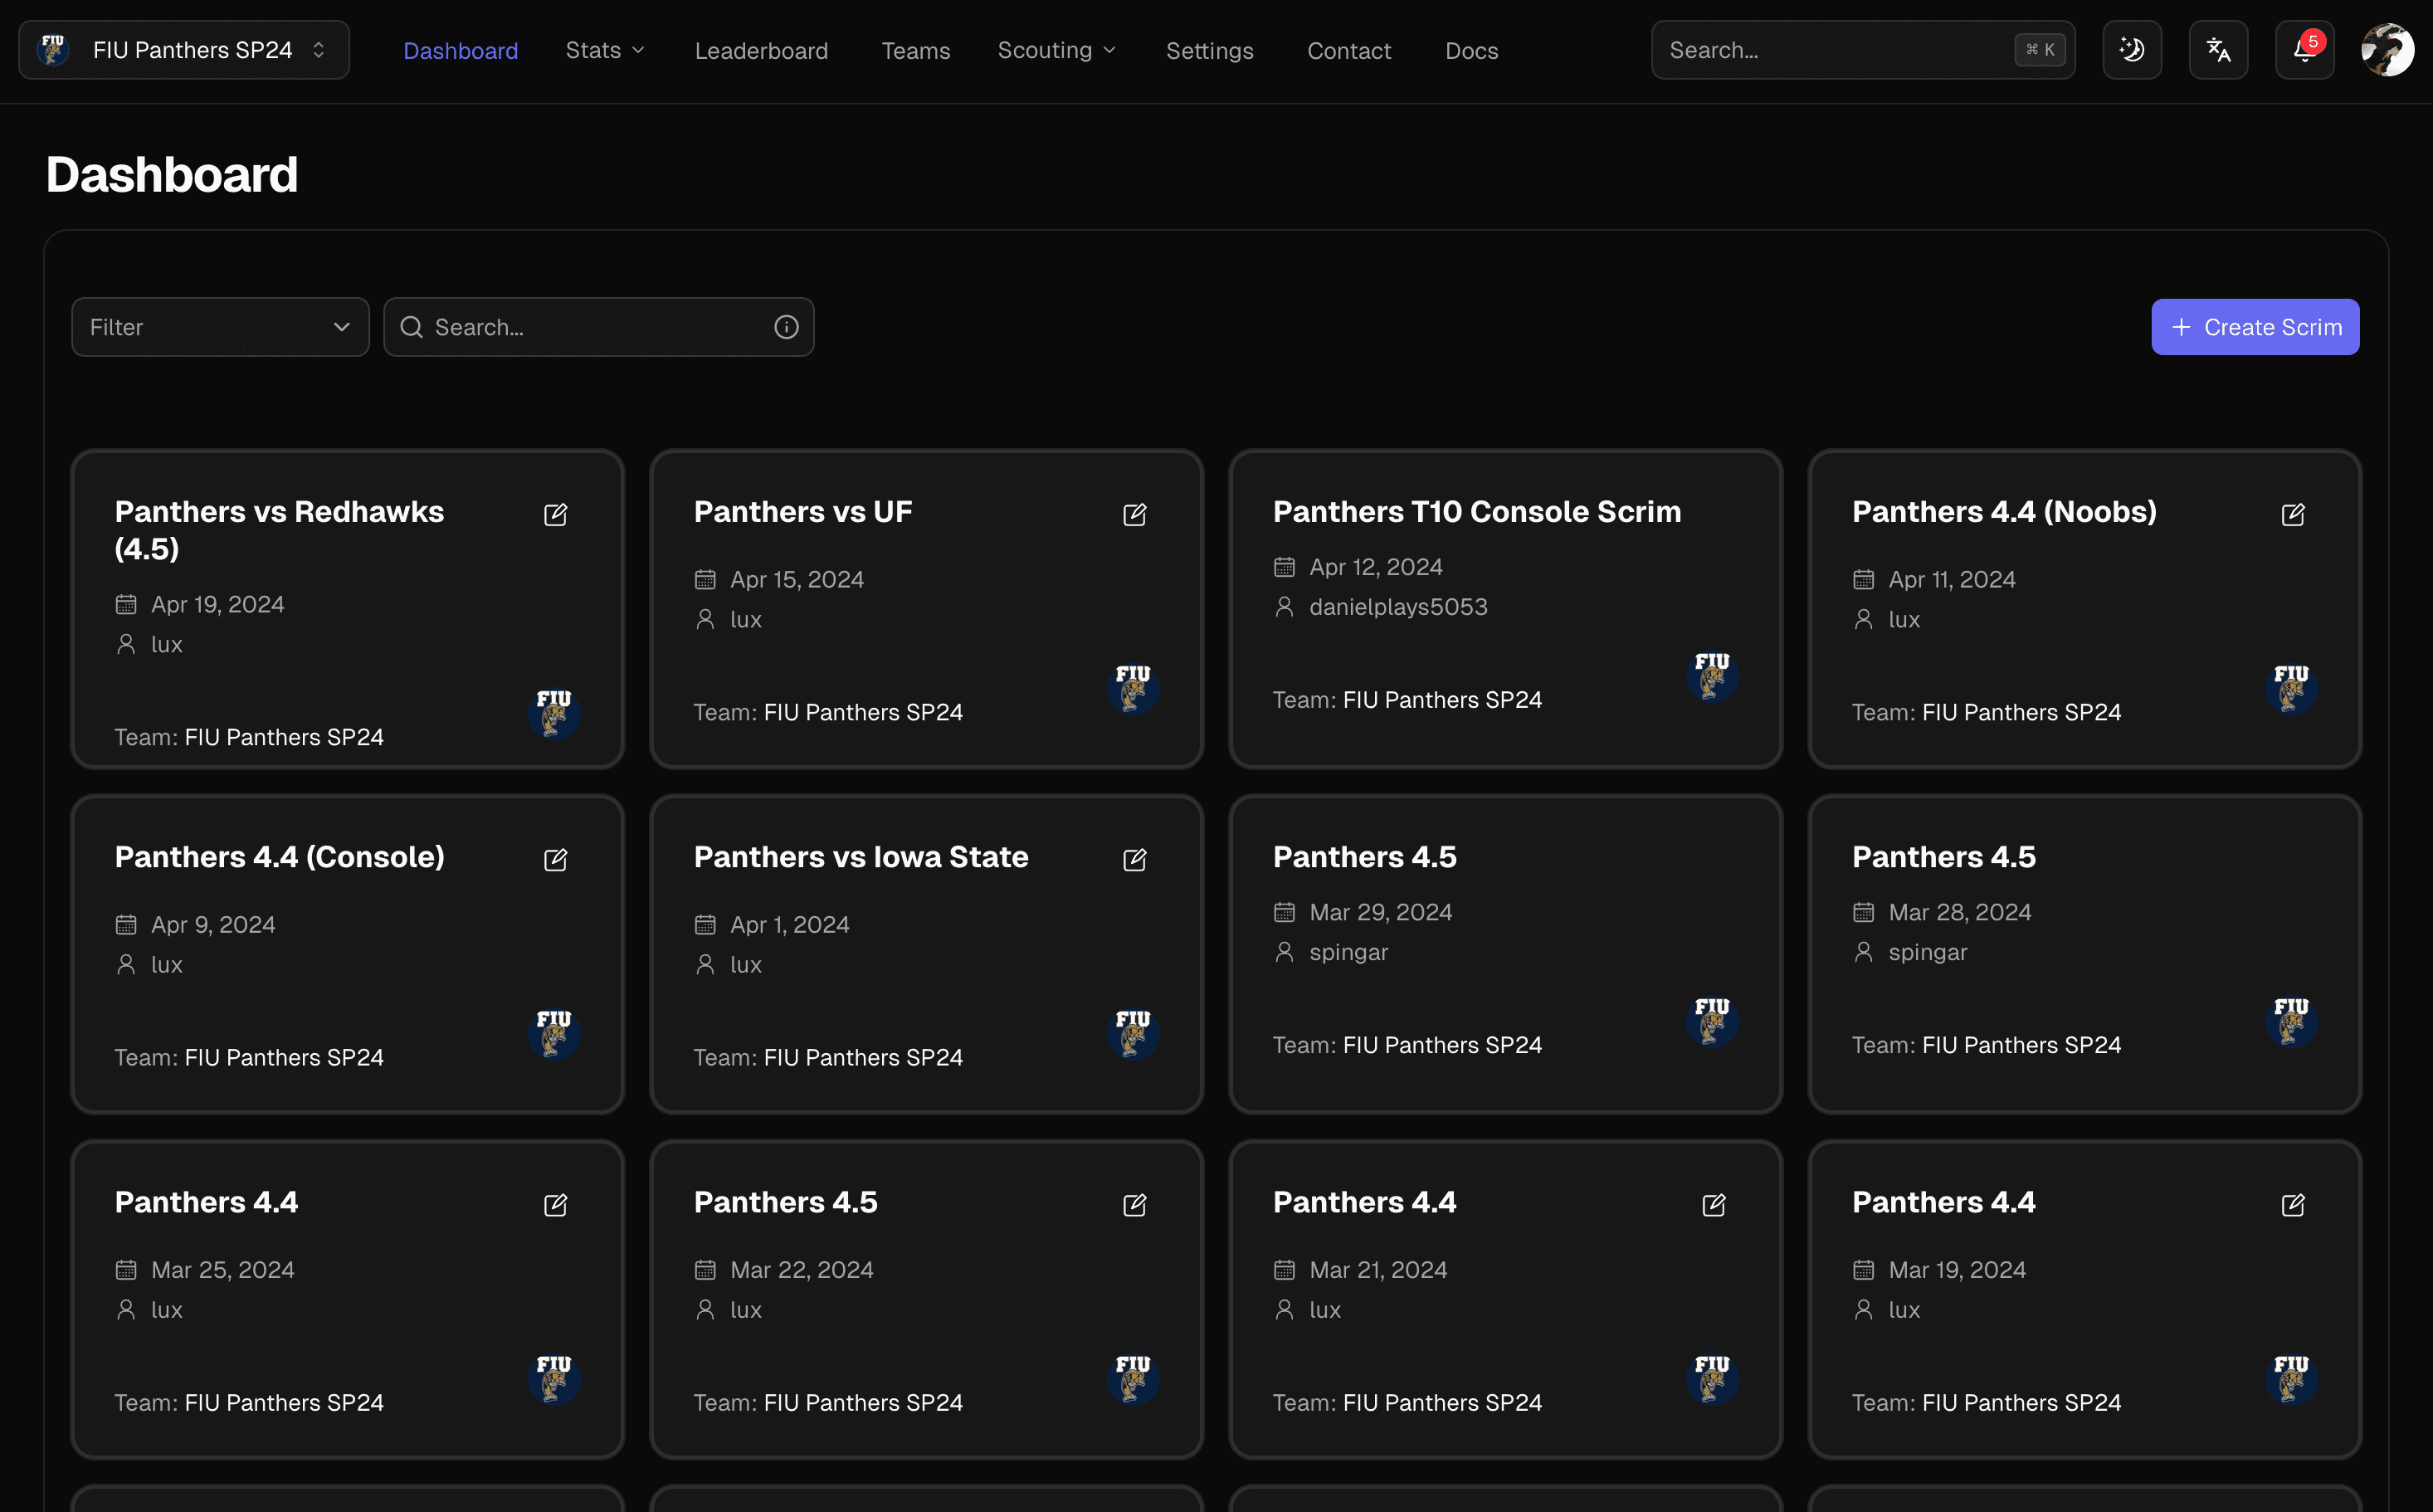
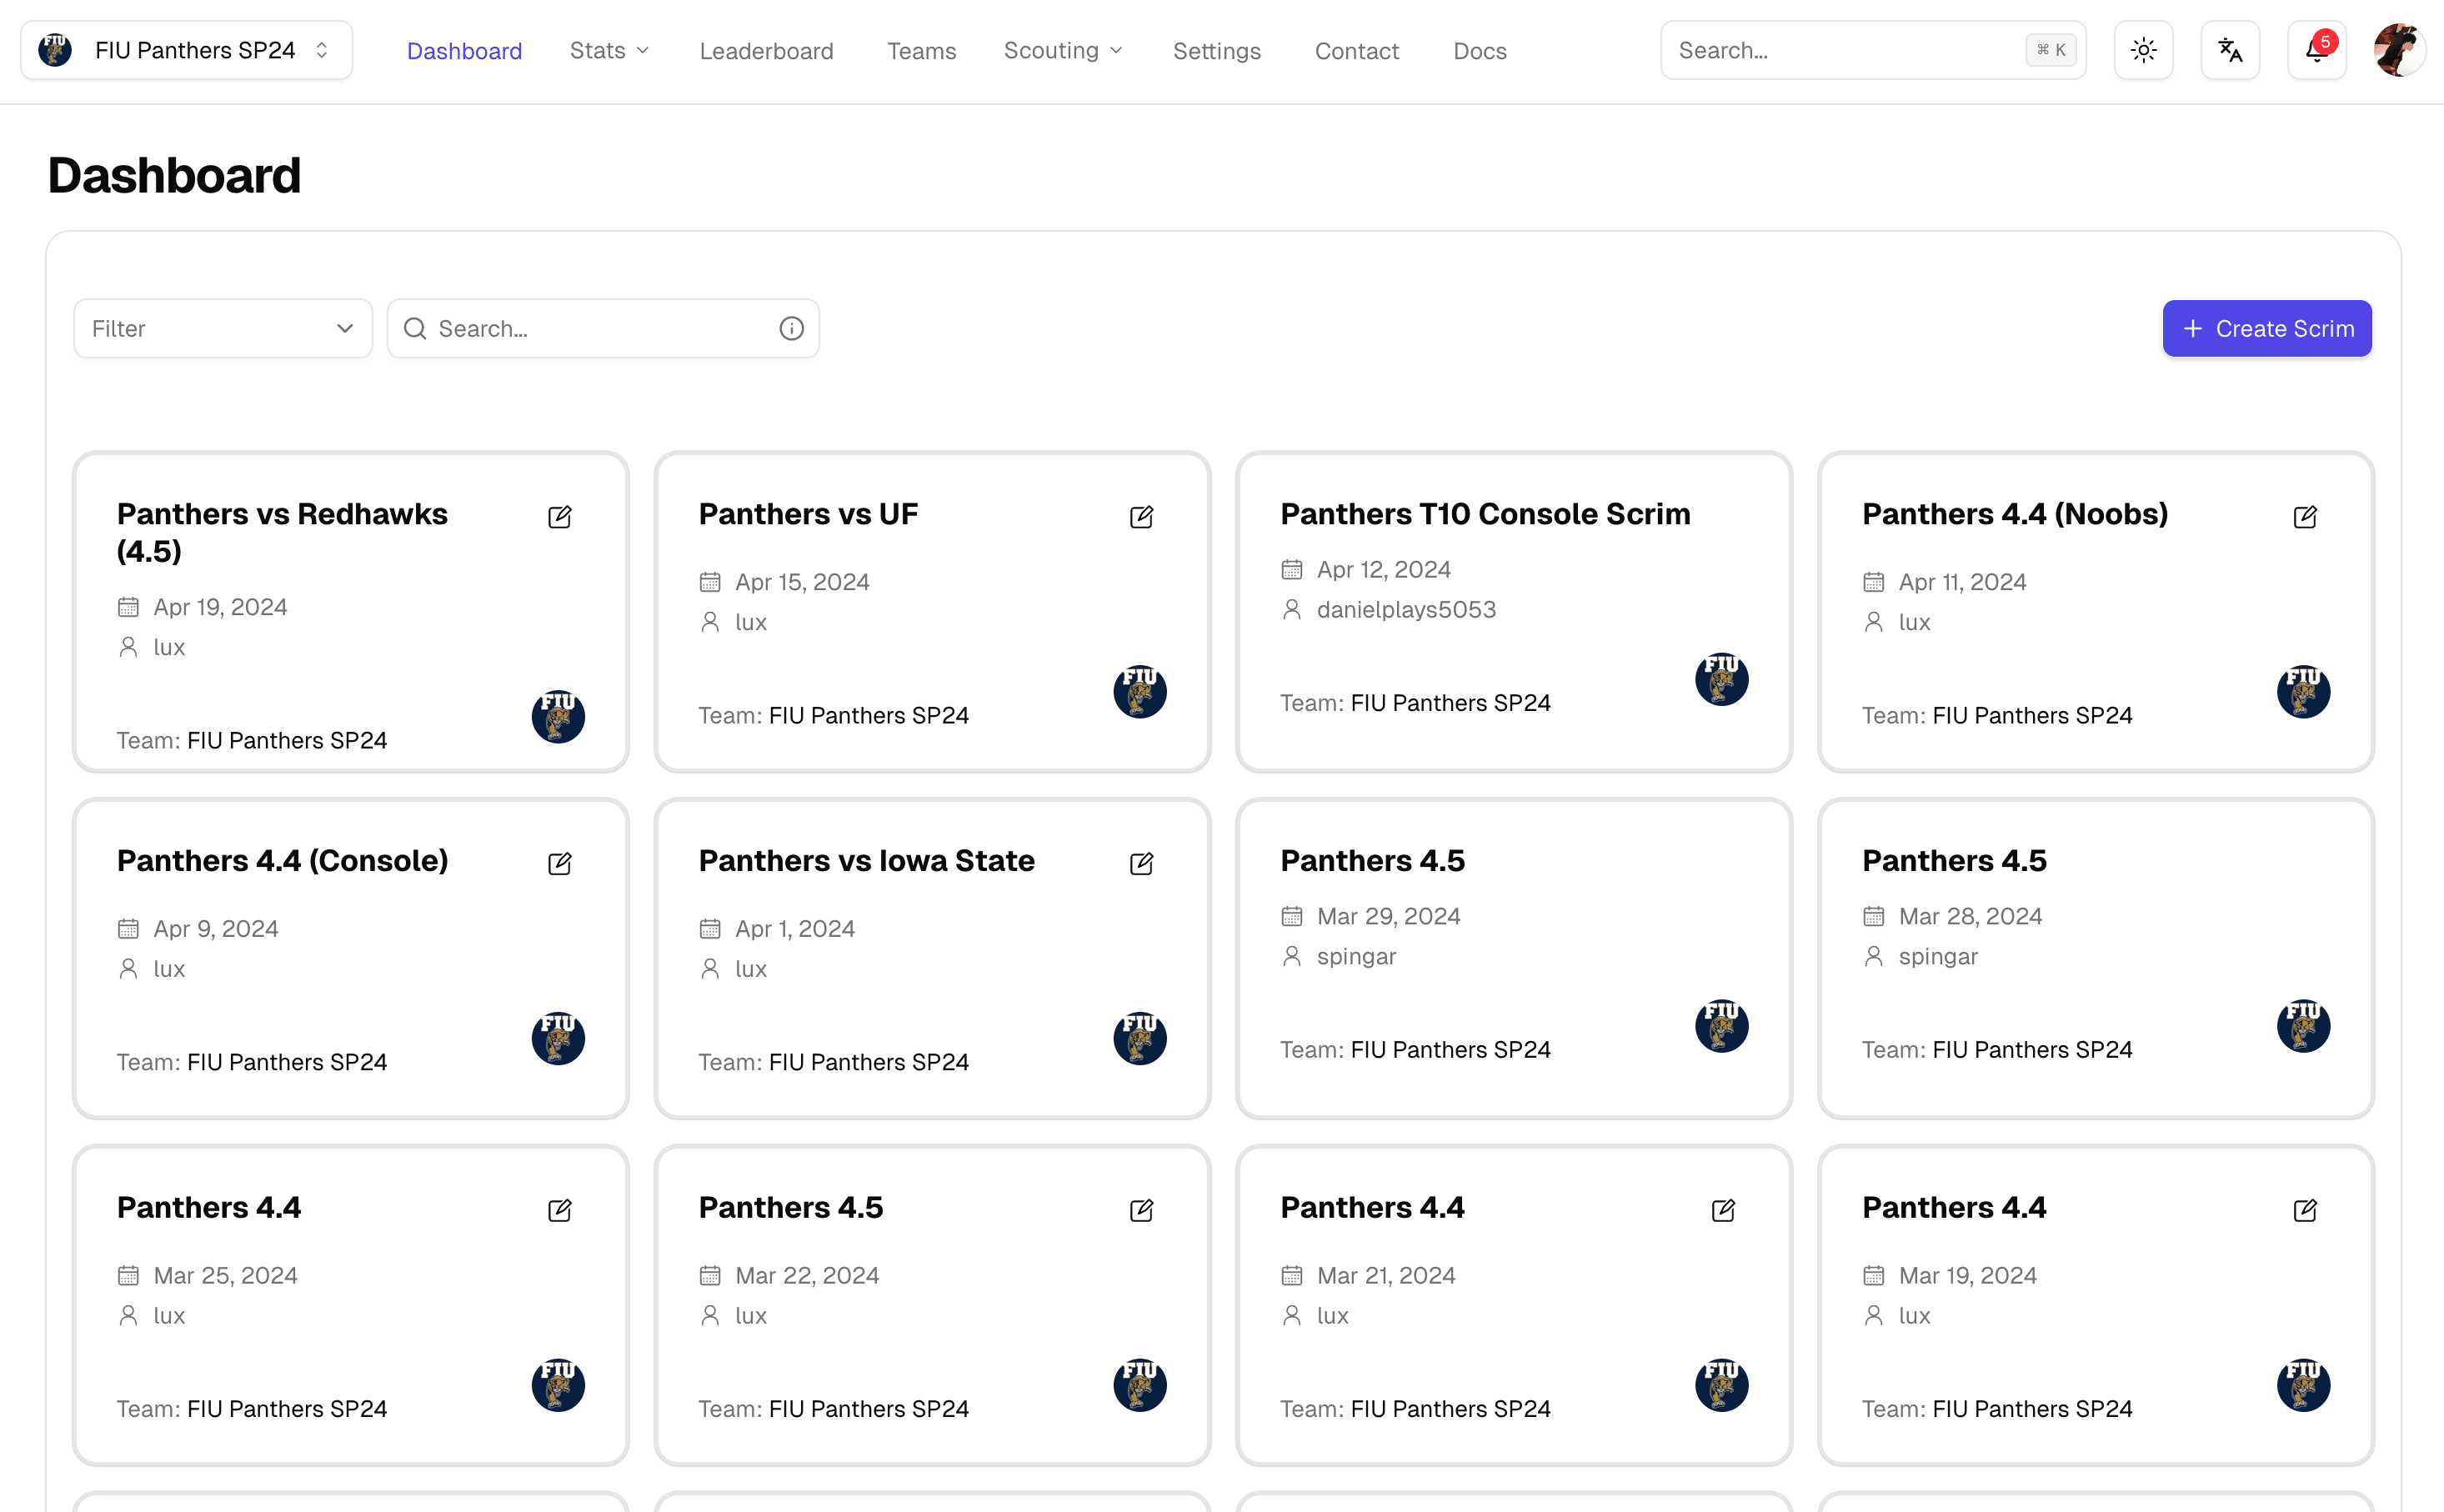
Invite players and coaches to a shared workspace where everyone sees the same data.

Track trends over time

Spot what's changing

Filter by week, month, or season to see how your team is progressing and where to focus next.

Private by default

Your data, your team

Passwordless login, team-scoped permissions, and zero data sharing. Your scrims stay yours.

“In my 8 years of coaching, I have used many different tools for analysis but this is the one I wish I had all along. Parsertime has been a game changer for us by identified trends and metrics that would otherwise be overlooked with just coaches watching alone. Both the ability to track team improvement incrementally and developing scouting plans based on scrim data make this tool a must for any serious coaches and teams.”

Photo of byZenith, head coach for Disguised
DSG byZenith (@byZenith)
Head Coach, Disguised